Technical Analysis of NVDU 2024-05-10
Overview:
In analyzing the technical indicators for NVDU over the last 5 days, we will delve into the trend, momentum, volatility, and volume indicators to provide a comprehensive outlook on the possible stock price movement. By examining these key aspects, we aim to offer valuable insights and predictions for the upcoming days.
Trend Analysis:
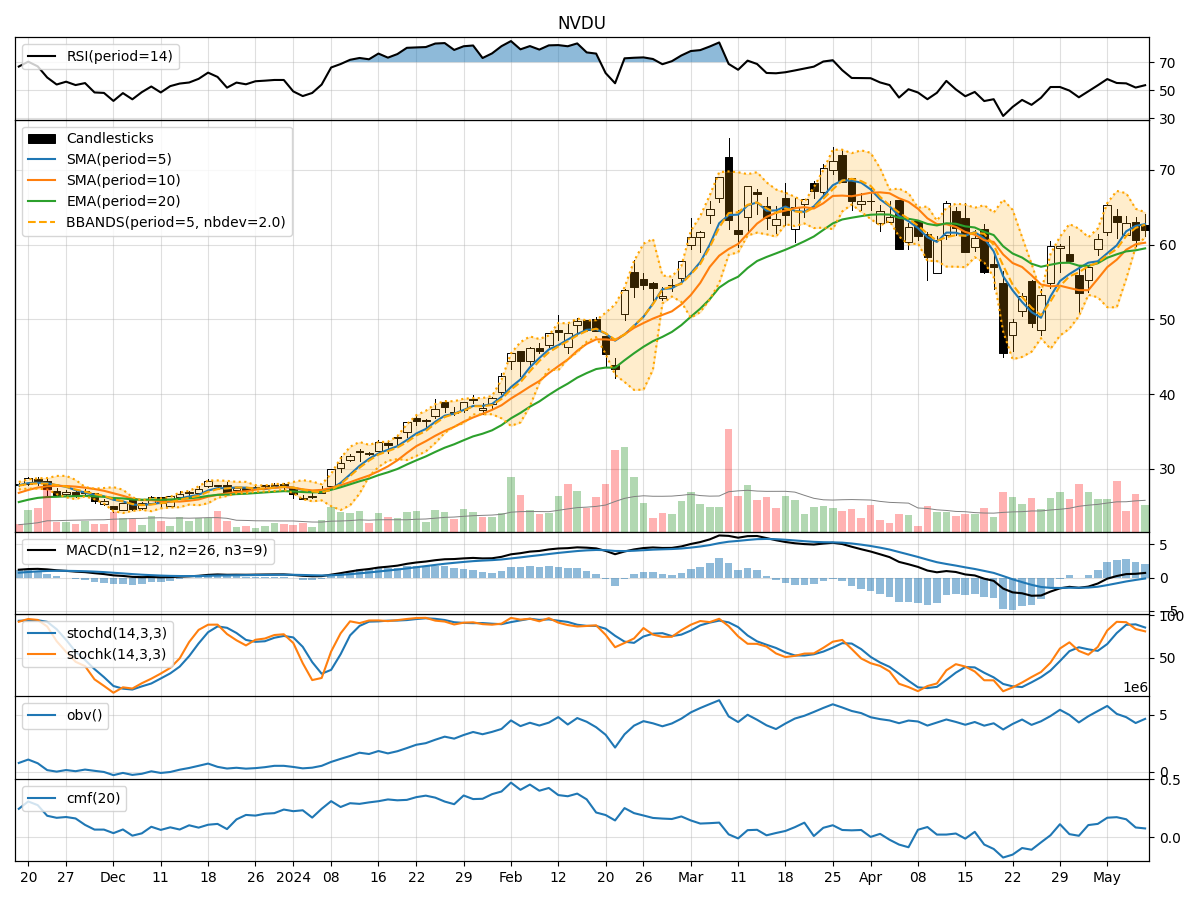
- Moving Averages (MA): The 5-day Moving Average (MA) has been consistently above the longer-term Simple Moving Average (SMA) and Exponential Moving Average (EMA), indicating a bullish trend.
- MACD: The Moving Average Convergence Divergence (MACD) has shown positive values, with the MACD line consistently above the Signal line, suggesting bullish momentum.
- Conclusion: The trend indicators point towards an upward trajectory for NVDU.
Momentum Analysis:
- RSI: The Relative Strength Index (RSI) has been fluctuating but generally staying within the neutral to overbought territory, indicating mixed momentum.
- Stochastic Oscillator: Both %K and %D have been relatively high, suggesting overbought conditions.
- Conclusion: The momentum indicators signal a mixed sentiment with a slight bearish bias.
Volatility Analysis:
- Bollinger Bands: The stock price has mostly stayed within the Bollinger Bands, with the bands narrowing, indicating decreasing volatility.
- Conclusion: Volatility is decreasing, which could lead to a period of consolidation or sideways movement.
Volume Analysis:
- On-Balance Volume (OBV): The OBV has shown mixed movements, indicating indecision among investors.
- Chaikin Money Flow (CMF): The CMF has been positive but decreasing, suggesting weakening buying pressure.
- Conclusion: Volume indicators reflect indecisiveness in the market with a slight bearish bias.
Overall Conclusion:
Based on the analysis of trend, momentum, volatility, and volume indicators, the next few days for NVDU could see upward price movement in the short term due to the bullish trend and positive MACD. However, the mixed momentum and decreasing volatility indicate a potential for consolidation or sideways movement before a clear direction is established. Investors should closely monitor key support and resistance levels for potential entry or exit points.
Key Recommendations:
- Monitor Price Action: Watch for any breakouts or breakdowns from key technical levels to confirm the direction.
- Risk Management: Implement proper risk management strategies to protect capital in case of unexpected price movements.
- Stay Informed: Keep track of any significant news or events that could impact the stock price.
In conclusion, while the technical indicators suggest a short-term bullish bias for NVDU, it is essential to exercise caution and remain vigilant in navigating the market dynamics to make informed investment decisions.