Technical Analysis of NVDX 2024-05-10
Overview:
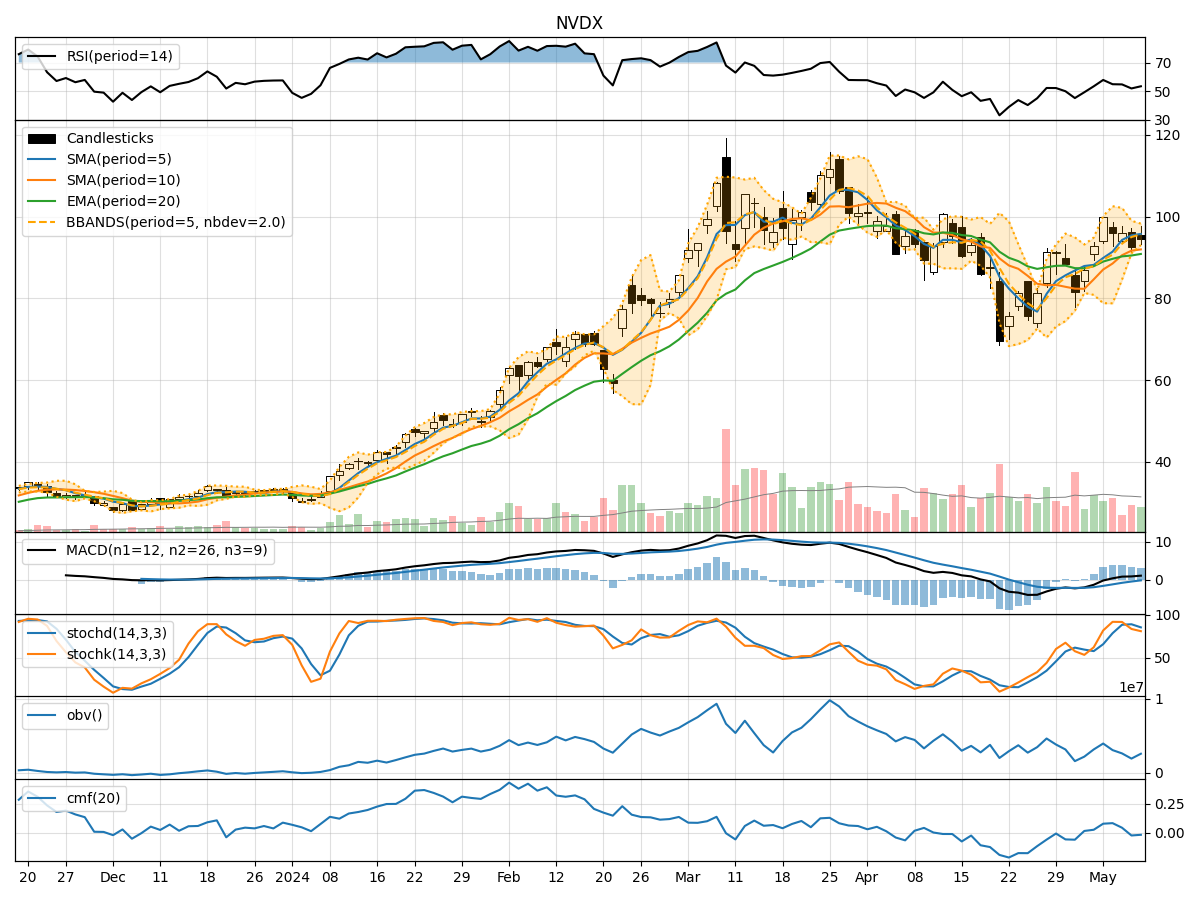
In analyzing the technical indicators for NVDX over the last 5 days, we will delve into the trends, momentum, volatility, and volume indicators to provide a comprehensive outlook on the possible stock price movement. By examining key metrics such as moving averages, MACD, RSI, Bollinger Bands, and OBV, we aim to offer valuable insights and predictions for the upcoming days.
Trend Indicators:
- Moving Averages (MA): The 5-day MA has been consistently above the closing prices, indicating a bullish trend.
- MACD: The MACD line has been above the signal line, suggesting a bullish momentum.
- EMA: The EMA has been trending upwards, supporting the bullish sentiment.
- Conclusion: The trend indicators point towards an upward movement in the stock price.
Momentum Indicators:
- RSI: The RSI has been fluctuating but remains in the neutral zone, indicating a balanced momentum.
- Stochastic Oscillator: Both %K and %D have shown a slight decline but are still in the overbought territory.
- Conclusion: The momentum indicators suggest a sideways movement in the stock price.
Volatility Indicators:
- Bollinger Bands (BB): The stock price has been trading within the bands, with the %B indicating a neutral position.
- Conclusion: Volatility is relatively stable, suggesting a consolidation phase in the stock price.
Volume Indicators:
- On-Balance Volume (OBV): The OBV has shown a mixed trend, indicating indecision among investors.
- Chaikin Money Flow (CMF): The CMF has been positive but declining, signaling a potential shift in buying pressure.
- Conclusion: Volume indicators reflect a neutral stance in the stock price movement.
Overall Conclusion:
Based on the analysis of trend, momentum, volatility, and volume indicators, the next few days for NVDX are likely to see a sideways movement with a slight upward bias. While the trend indicators are bullish, the momentum and volume indicators suggest a more cautious approach. The stock is expected to consolidate within a range, with potential for a modest uptick in the near term. Traders should closely monitor key support and resistance levels for potential entry and exit points.
Key Recommendations:
- Monitor Price Levels: Keep a close eye on key support and resistance levels for potential breakout or breakdown scenarios.
- Watch Momentum: Track the RSI and Stochastic Oscillator for any signs of a shift in momentum.
- Consider Risk Management: Implement proper risk management strategies to protect capital in case of unexpected price movements.
- Stay Informed: Stay updated on market news and events that could impact the stock price.
By combining technical analysis with market insights, traders can make informed decisions and navigate the dynamic landscape of the stock market effectively.