Technical Analysis of SHV 2024-05-10
Overview:
In analyzing the technical indicators for SHV over the last 5 days, we will delve into the trend, momentum, volatility, and volume indicators to provide a comprehensive outlook on the possible stock price movement in the coming days. By examining these key aspects, we aim to offer valuable insights and predictions to guide investment decisions.
Trend Analysis:
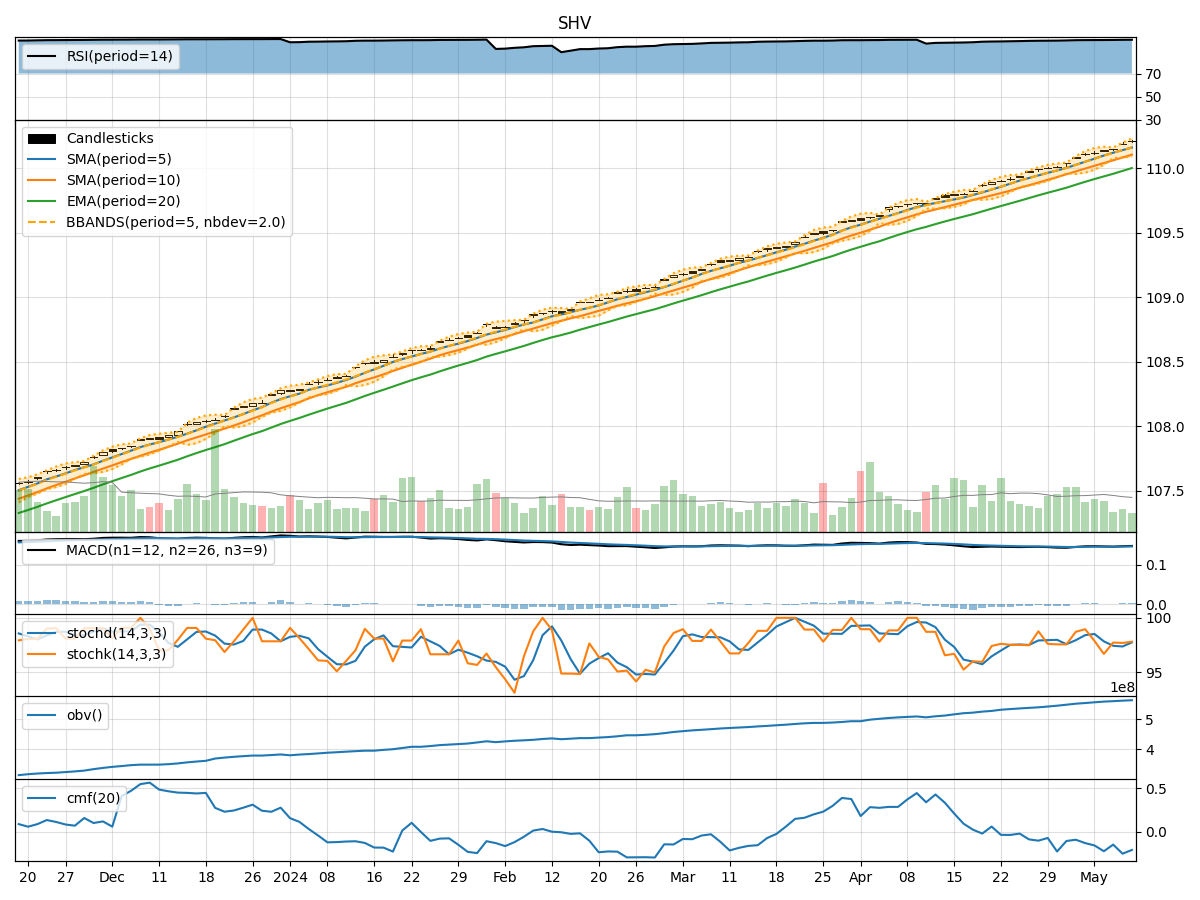
- Moving Averages (MA): The moving averages show a consistent uptrend over the last 5 days, with the closing price consistently above the short-term moving averages.
- MACD: The MACD line has been positive, indicating a bullish momentum in the stock.
- EMA: The exponential moving average has been steadily increasing, reflecting a positive trend in the stock price.
Key Observation: The trend indicators suggest a strong bullish sentiment in the stock.
Momentum Analysis:
- RSI: The Relative Strength Index has been consistently high, indicating an overbought condition in the stock.
- Stochastic Oscillator: Both %K and %D have been in the overbought zone, signaling a potential reversal.
- Williams %R: The Williams %R is in the oversold territory, suggesting a possible reversal in the stock price.
Key Observation: The momentum indicators point towards a potential reversal or correction in the stock price.
Volatility Analysis:
- Bollinger Bands: The stock price has been trading within the upper Bollinger Band, indicating high volatility.
- Bollinger %B: The %B indicator shows the stock price nearing the upper band, suggesting a potential overbought condition.
- Average True Range (ATR): The ATR has been relatively stable, indicating consistent volatility in the stock.
Key Observation: The volatility indicators suggest a high level of volatility in the stock, potentially leading to a price correction.
Volume Analysis:
- On-Balance Volume (OBV): The OBV has been steadily increasing, indicating accumulation of the stock.
- Chaikin Money Flow (CMF): The CMF has been negative, suggesting a bearish money flow in the stock.
Key Observation: The volume indicators show mixed signals, with OBV indicating accumulation while CMF suggests bearish money flow.
Conclusion:
Based on the analysis of the technical indicators, the stock is currently in an overbought condition with strong bullish momentum. However, the high volatility and potential reversal signals from the momentum indicators indicate a possible correction in the stock price in the coming days. Traders should exercise caution and consider taking profits or implementing risk management strategies in anticipation of a downward movement in the stock price.