Technical Analysis of SOXS 2024-05-10
Overview:
In analyzing the technical indicators for SOXS over the last 5 days, we will delve into the trend, momentum, volatility, and volume indicators to provide a comprehensive outlook on the possible stock price movement. By examining these key aspects, we aim to offer valuable insights and predictions for the upcoming days.
Trend Analysis:
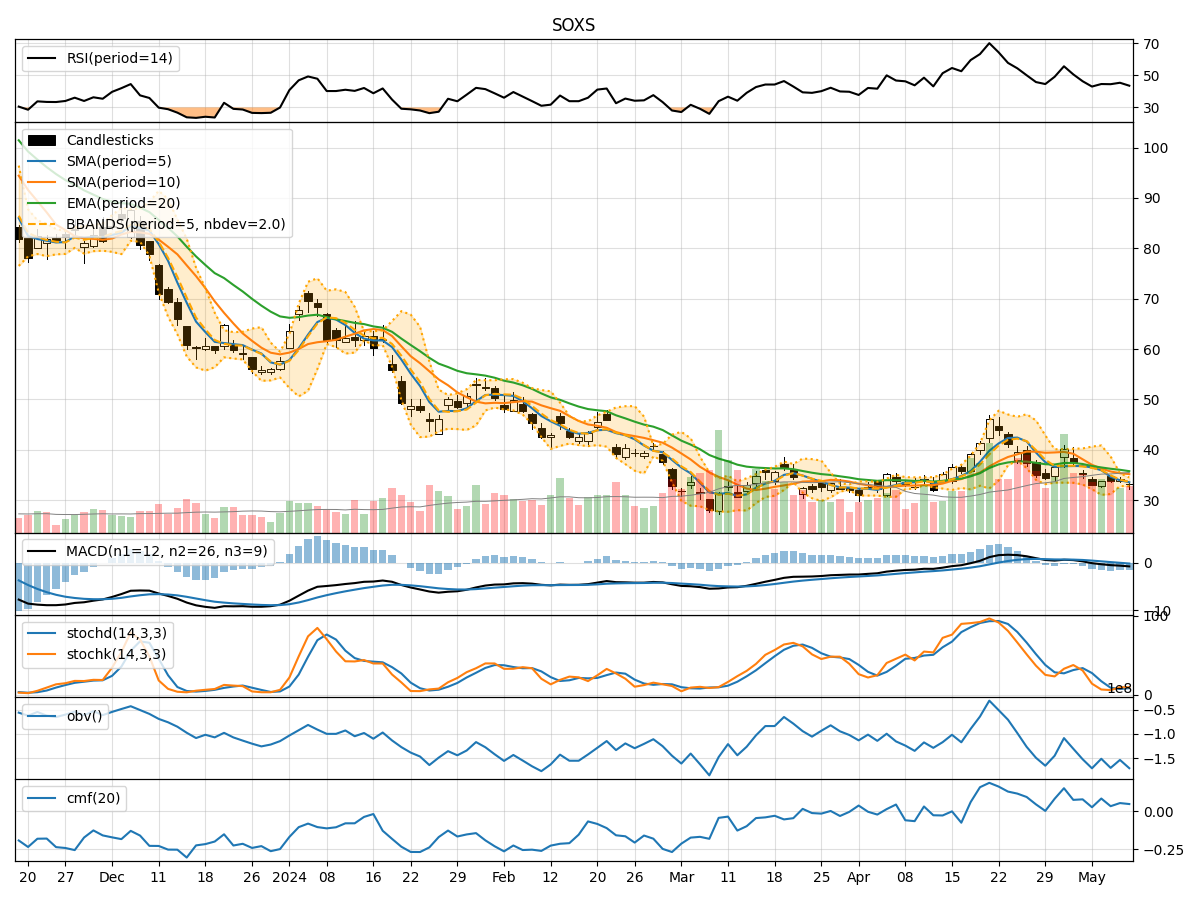
- Moving Averages (MA): The 5-day moving average has been consistently below the simple moving average (SMA) and exponential moving average (EMA), indicating a downward trend.
- MACD: The MACD line has been below the signal line for the past 5 days, with the MACD histogram showing negative values, suggesting bearish momentum.
Momentum Analysis:
- RSI: The Relative Strength Index (RSI) has been hovering around 40-45, indicating a neutral stance without strong overbought or oversold conditions.
- Stochastic Oscillator: Both %K and %D have been relatively low, suggesting a lack of strong buying or selling pressure.
Volatility Analysis:
- Bollinger Bands (BB): The stock price has been consistently trading below the middle Bollinger Band (BBM), indicating a lower volatility environment.
- Bollinger %B (BBP): The %B has been below 0.5 for the past few days, indicating the stock is trading below the lower Bollinger Band.
Volume Analysis:
- On-Balance Volume (OBV): The OBV has shown mixed movements, indicating indecision among market participants.
- Chaikin Money Flow (CMF): The CMF has been relatively low, suggesting a lack of strong buying or selling pressure based on both price and volume.
Key Observations and Opinions:
- Trend: The trend indicators suggest a continued downward trajectory for SOXS.
- Momentum: The momentum indicators reflect a lack of strong buying or selling pressure, indicating a neutral stance.
- Volatility: The lower volatility environment implies a lack of significant price fluctuations.
- Volume: Mixed volume indicators point towards indecision among investors.
Conclusion:
Based on the analysis of the technical indicators, the next few days for SOXS are likely to see further downward movement. The trend, momentum, and volume indicators all point towards a bearish outlook, with low volatility reinforcing the lack of significant price movements. Traders and investors should exercise caution and consider short-term strategies aligned with the prevailing bearish sentiment in the market.