Technical Analysis of ACB 2024-05-10
Overview:
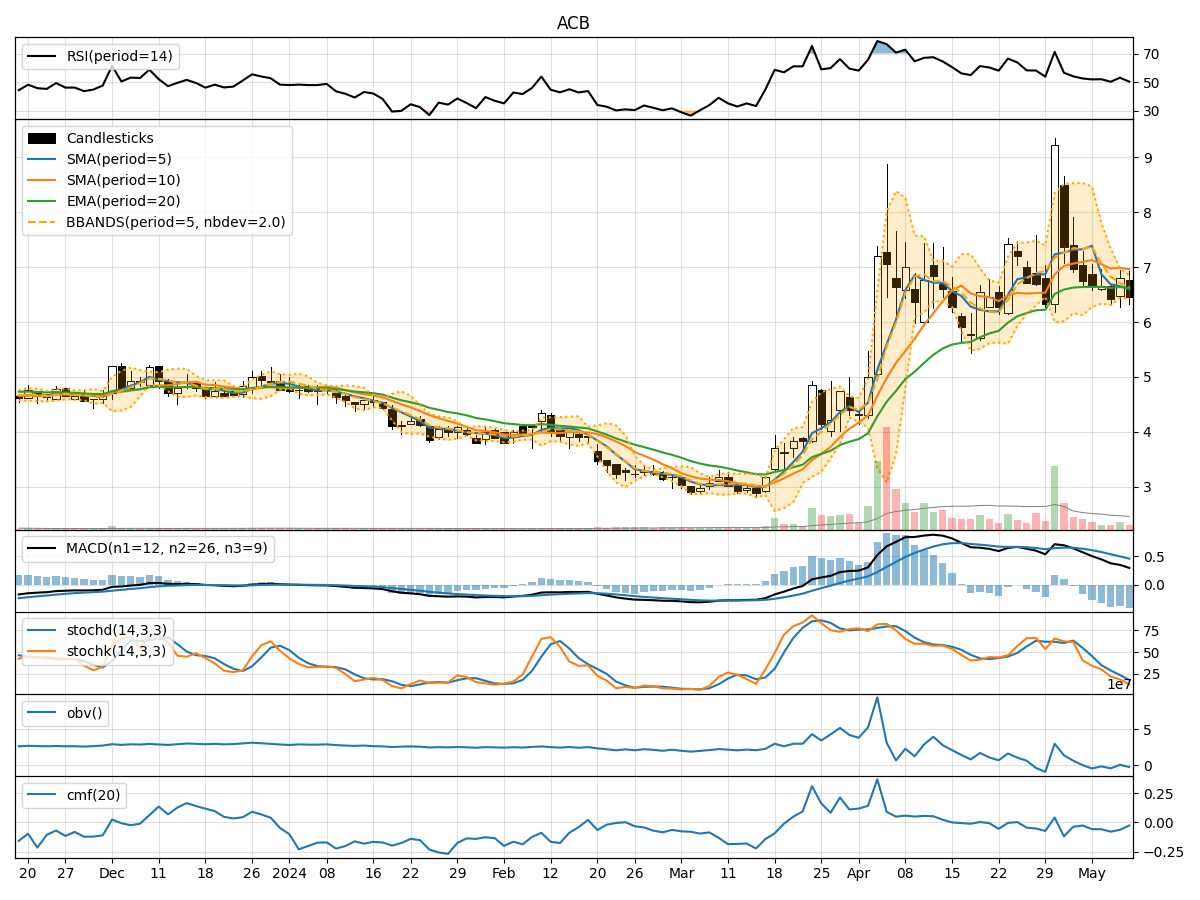
In analyzing the technical indicators for ACB over the last 5 days, we will delve into the trend, momentum, volatility, and volume indicators to provide a comprehensive outlook on the possible stock price movement. By examining these key aspects, we aim to offer valuable insights and predictions for the upcoming days.
Trend Analysis:
- Moving Averages (MA): The 5-day MA has been consistently below the closing price, indicating a short-term downtrend.
- MACD: The MACD line has been below the signal line, suggesting a bearish momentum.
- RSI: The RSI has been hovering around the neutral zone, reflecting indecision in the market sentiment.
Momentum Analysis:
- Stochastic Oscillator: Both %K and %D have been declining, signaling a potential oversold condition.
- Williams %R: The indicator has been in the oversold territory, indicating a possible reversal.
Volatility Analysis:
- Bollinger Bands (BB): The price has been trading within the lower Bollinger Band, suggesting a period of low volatility.
- BB% (Bollinger Band Percentage): The BB% has been relatively low, indicating a lack of significant price movement.
Volume Analysis:
- On-Balance Volume (OBV): The OBV has been decreasing, indicating selling pressure in the market.
- Chaikin Money Flow (CMF): The CMF has been negative, suggesting outflow of money from the stock.
Key Observations:
- The stock is currently in a downtrend based on moving averages and MACD.
- Momentum indicators like Stochastic and Williams %R suggest a potential reversal due to oversold conditions.
- Volatility is low, as indicated by Bollinger Bands and BB%, signaling a period of consolidation.
- Volume indicators reflect selling pressure with a negative OBV and CMF.
Conclusion:
Based on the analysis of technical indicators, the next few days for ACB are likely to see further downside movement in the stock price. The current trend, momentum, and volume signals point towards a continuation of the bearish sentiment. However, the oversold conditions indicated by momentum indicators could lead to a short-term bounce or consolidation before any significant recovery. Traders should exercise caution and consider waiting for confirmation of a trend reversal before considering long positions.