Technical Analysis of DAVE 2024-05-10
Overview:
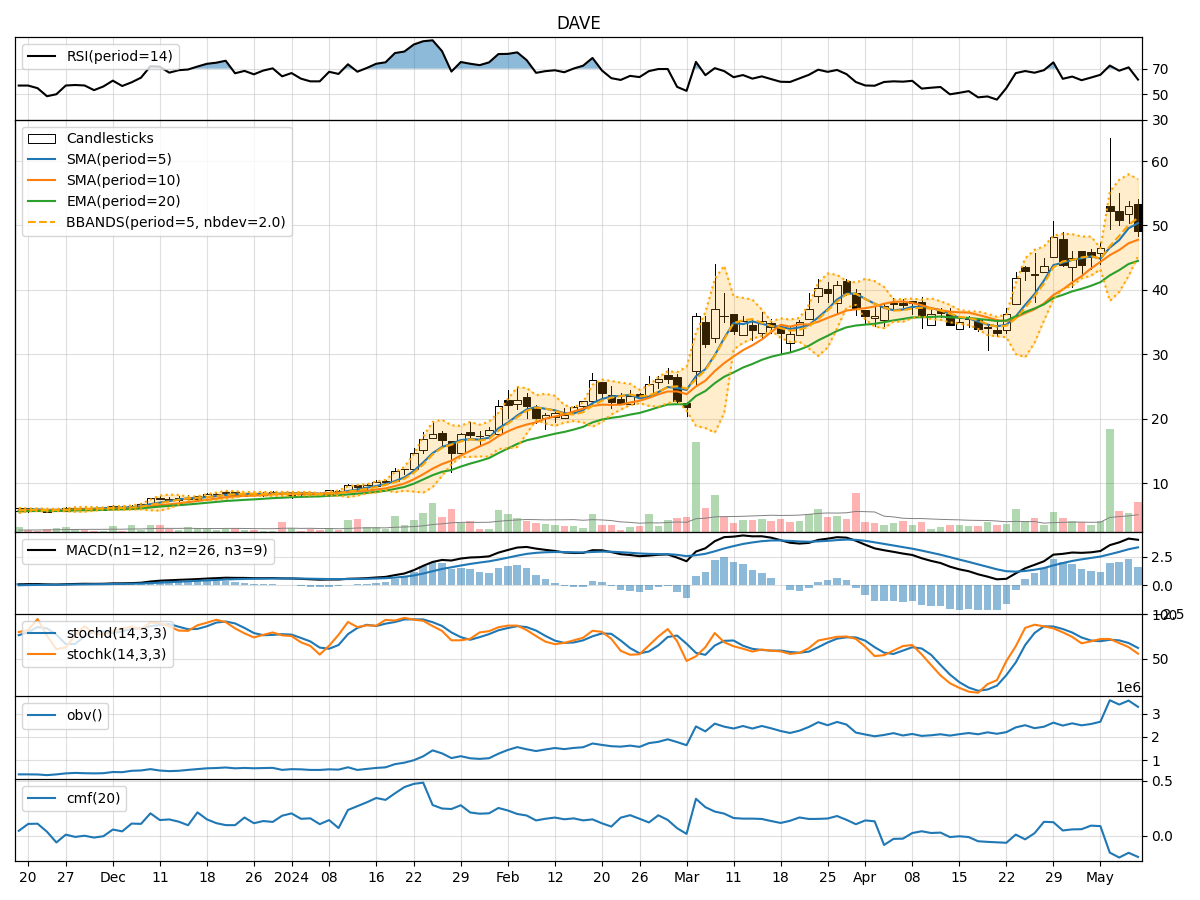
In the last 5 trading days, DAVE stock has shown fluctuations in price and volume. The trend indicators suggest a gradual increase in the moving averages and MACD values. Momentum indicators like RSI and Stochastic oscillators indicate a mix of overbought and oversold conditions. Volatility indicators show widening Bollinger Bands, indicating increased price volatility. Volume indicators like OBV and CMF suggest a slight decrease in buying pressure.
Trend Analysis:
- Moving averages (MA) have been steadily increasing, indicating a bullish trend.
- MACD values have been positive and rising, suggesting increasing bullish momentum.
- Overall, the trend indicators point towards an upward trend in the stock price.
Momentum Analysis:
- RSI values have been fluctuating but generally staying above 50, indicating bullish momentum.
- Stochastic oscillators show a mix of overbought and oversold conditions, suggesting potential price reversals.
- The Williams %R indicator is in oversold territory, indicating a possible buying opportunity.
- Momentum indicators suggest a potential short-term consolidation or minor pullback before resuming the upward trend.
Volatility Analysis:
- Bollinger Bands have been widening, indicating increased price volatility.
- The Bollinger Band %B indicator is below 1, suggesting the price is below the lower band and potentially oversold.
- Volatility indicators point towards increased price volatility in the coming days.
Volume Analysis:
- On-Balance Volume (OBV) has shown a slight decrease, indicating a minor decrease in buying pressure.
- Chaikin Money Flow (CMF) is negative, suggesting a slight outflow of money from the stock.
- Volume indicators hint at a slight decrease in buying interest in the stock.
Conclusion:
Based on the technical analysis of DAVE stock: - The trend indicators suggest an upward trend in the stock price. - Momentum indicators indicate a potential short-term consolidation or minor pullback before resuming the uptrend. - Volatility indicators point towards increased price volatility in the near future. - Volume indicators hint at a slight decrease in buying interest.
Overall Assessment:
Considering the overall analysis, DAVE stock is likely to experience short-term consolidation or a minor pullback due to the mixed signals from momentum indicators. However, the overall trend remains bullish, indicating that any pullback could present a buying opportunity for investors looking to capitalize on the upward trend. Traders should closely monitor key support and resistance levels to make informed trading decisions.