Technical Analysis of GMGI 2024-05-10
Overview:
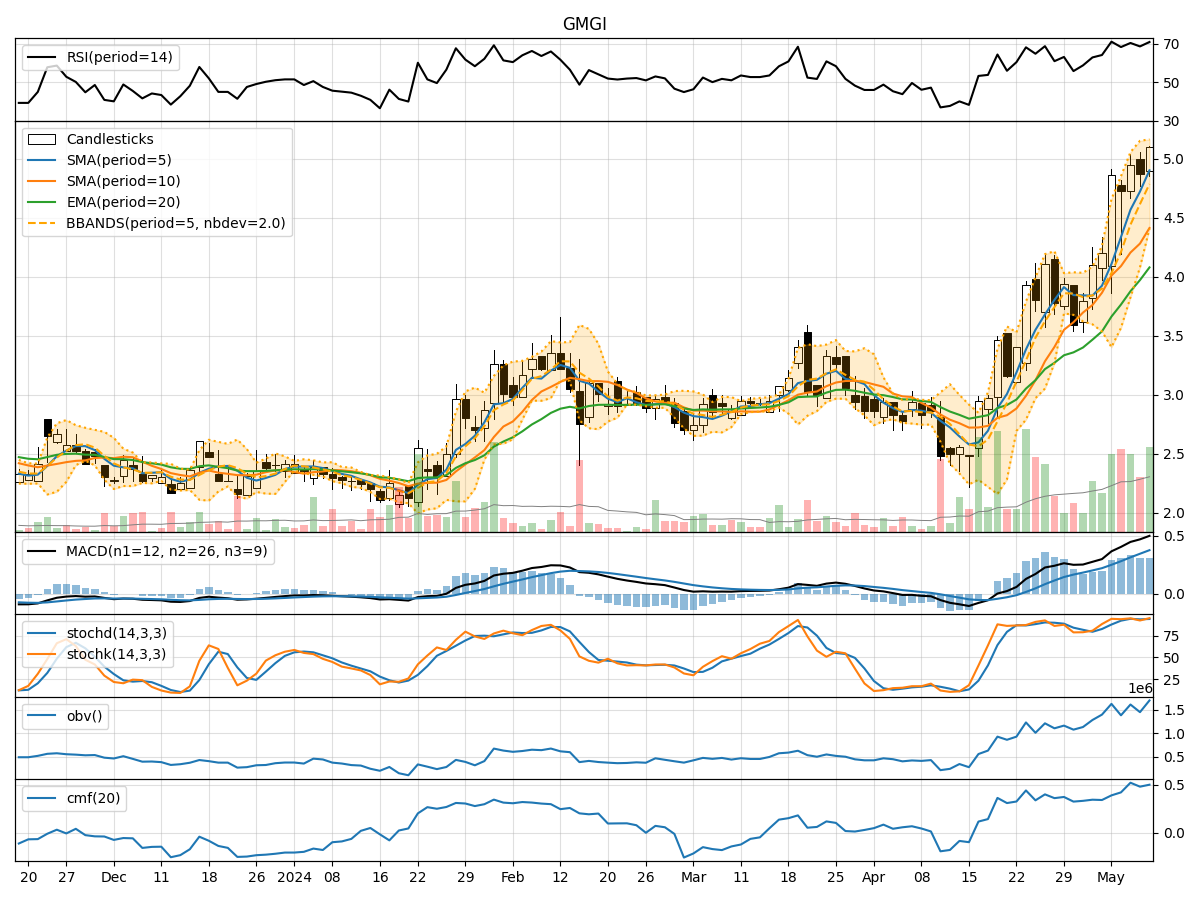
In analyzing the technical indicators for GMGI over the last 5 days, we will delve into the trend, momentum, volatility, and volume indicators to provide a comprehensive assessment of the stock's potential price movement. By examining these key factors, we aim to offer valuable insights and predictions for the next few days.
Trend Analysis:
- Moving Averages (MA): The 5-day MA has been consistently rising, indicating a bullish trend in the short term.
- MACD: The MACD line has been above the signal line, suggesting positive momentum.
- EMA: The EMA has been steadily increasing, supporting the bullish trend.
Key Observation: The trend indicators point towards an upward trend in the stock price.
Momentum Analysis:
- RSI: The RSI has been fluctuating around the overbought territory, indicating strong buying momentum.
- Stochastic Oscillator: Both %K and %D have been in the overbought zone, signaling potential overvaluation.
- Williams %R: The Williams %R has been hovering in the oversold region, suggesting a potential reversal.
Key Observation: Momentum indicators suggest a mixed sentiment with a slight overbought condition.
Volatility Analysis:
- Bollinger Bands: The stock price has been trading within the upper Bollinger Band, indicating increased volatility.
- Bollinger %B: The %B value has been fluctuating, reflecting the stock's volatility.
Key Observation: Volatility indicators point towards increased volatility in the stock price.
Volume Analysis:
- On-Balance Volume (OBV): The OBV has shown an overall positive trend, indicating accumulation by investors.
- Chaikin Money Flow (CMF): The CMF has been positive, suggesting buying pressure in the stock.
Key Observation: Volume indicators suggest positive accumulation and buying pressure.
Conclusion:
Based on the analysis of the technical indicators, the stock of GMGI is likely to experience upward price movement in the next few days. The trend indicators support a bullish outlook, while momentum indicators show a mixed sentiment with a slight overbought condition. Volatility is expected to remain high, indicating potential price swings, and volume indicators signal positive accumulation and buying pressure.
Overall Assessment: The stock is likely to continue its upward trajectory, with potential short-term fluctuations due to increased volatility. Investors should consider capitalizing on buying opportunities during pullbacks for potential gains.
Recommendation: Consider buying GMGI for short to medium-term gains, while closely monitoring price movements and adjusting stop-loss levels to manage risk effectively.