Technical Analysis of HCP 2024-05-10
Overview:
In analyzing the technical indicators for HCP stock over the last 5 days, we will delve into the trend, momentum, volatility, and volume indicators to provide a comprehensive outlook on the possible future stock price movement. By examining these key indicators, we aim to offer valuable insights and recommendations for potential investors.
Trend Analysis:
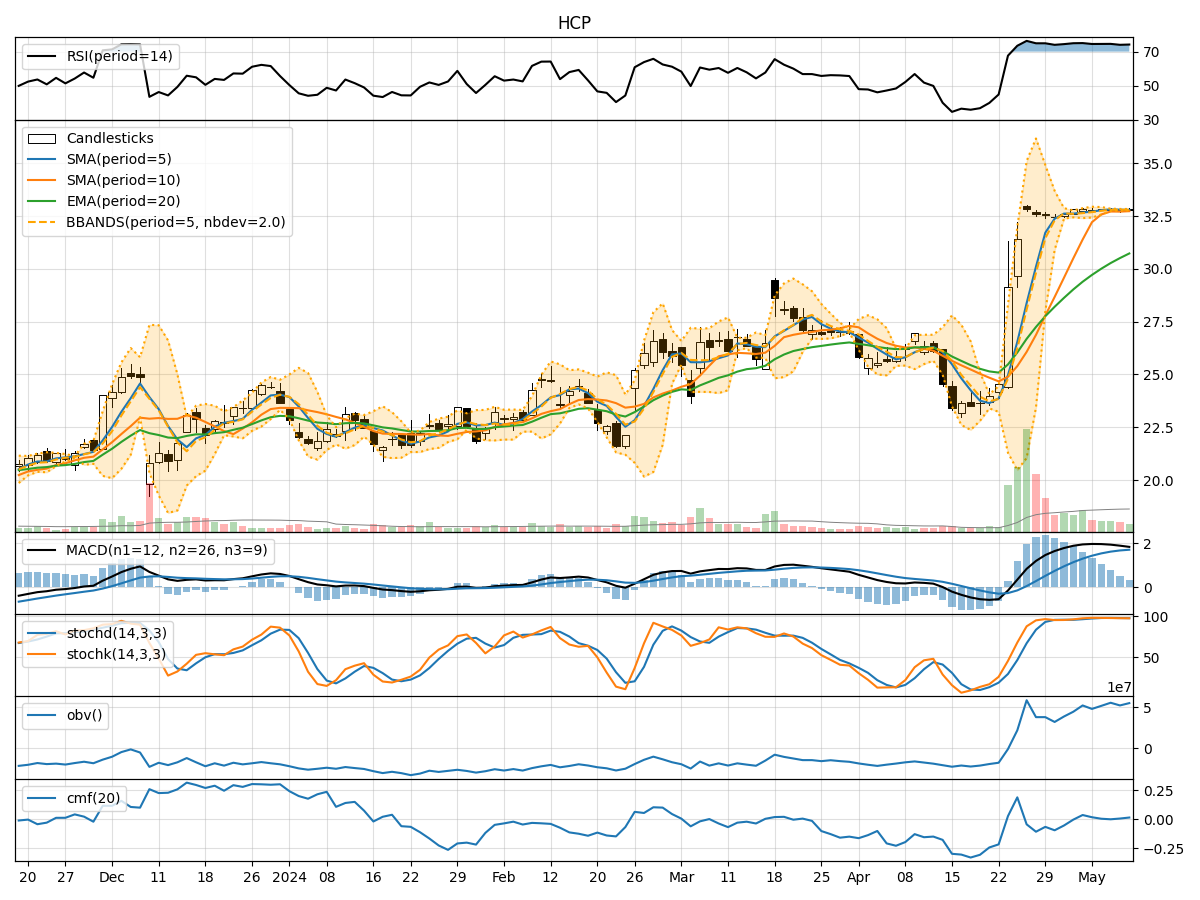
- Moving Averages (MA): The 5-day Moving Average (MA) has been consistently above the Simple Moving Average (SMA) and Exponential Moving Average (EMA), indicating a bullish trend.
- MACD: The MACD line has been above the signal line, with both lines showing an upward trend, suggesting bullish momentum.
Momentum Analysis:
- RSI: The Relative Strength Index (RSI) has been consistently above 70, indicating overbought conditions but also strong bullish momentum.
- Stochastic Oscillator: Both %K and %D lines have been in the overbought zone, suggesting a strong bullish sentiment.
Volatility Analysis:
- Bollinger Bands (BB): The stock price has been trading within the upper Bollinger Band, indicating high volatility and potential overbought conditions.
Volume Analysis:
- On-Balance Volume (OBV): The OBV has been showing an overall increase, suggesting accumulation by investors.
- Chaikin Money Flow (CMF): The CMF has been positive, indicating buying pressure in the stock.
Key Observations:
- The stock is currently in a strong bullish trend based on moving averages and MACD.
- Momentum indicators like RSI and Stochastic Oscillator suggest overbought conditions but also strong bullish sentiment.
- Volatility is high, as indicated by the upper Bollinger Band, which may lead to a potential pullback.
- Volume indicators show accumulation and buying pressure, supporting the bullish outlook.
Conclusion:
Based on the analysis of the technical indicators, the next few days' possible stock price movement for HCP is likely to continue in an upward direction. The bullish trend, supported by momentum and volume indicators, suggests that the stock may experience further price appreciation. However, given the high volatility and overbought conditions, investors should be cautious of a potential pullback or consolidation in the short term. Overall, the outlook remains bullish with a potential for further upside movement.