Technical Analysis of INCY 2024-05-10
Overview:
In analyzing the technical indicators for INCY over the last 5 days, we will delve into the trends, momentum, volatility, and volume indicators to provide a comprehensive outlook on the possible stock price movement in the coming days. By examining these key aspects, we aim to offer valuable insights and predictions for potential investors.
Trend Analysis:
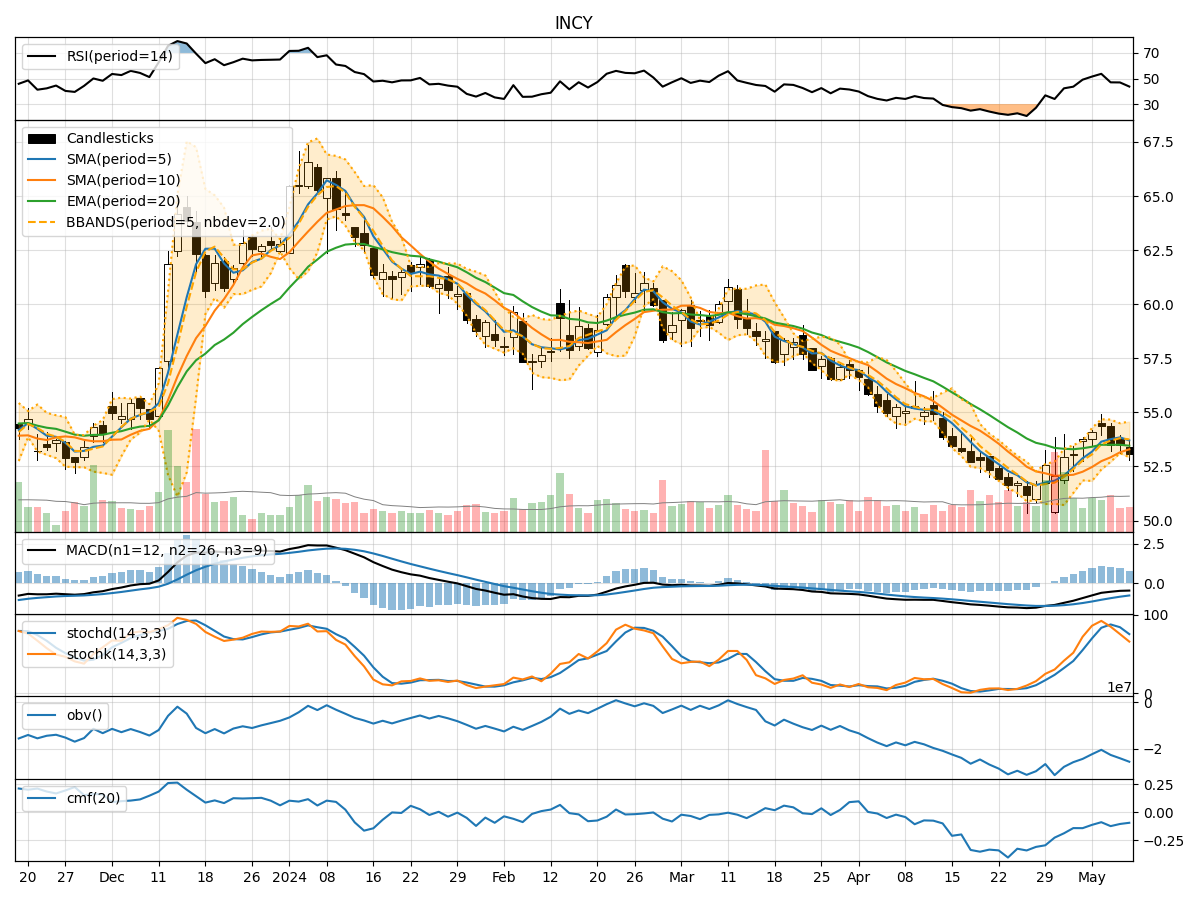
- Moving Averages (MA): The 5-day Moving Average (MA) has been fluctuating around the stock price, indicating short-term price trends. The Simple Moving Average (SMA) and Exponential Moving Average (EMA) show a slight divergence, suggesting potential price volatility.
- Moving Average Convergence Divergence (MACD): The MACD line has been negative, but the MACD Histogram is showing signs of convergence, indicating a possible shift in momentum.
Momentum Analysis:
- Relative Strength Index (RSI): The RSI has been fluctuating within the overbought and oversold levels, reflecting mixed investor sentiment.
- Stochastic Oscillator: Both %K and %D levels have been declining, signaling a potential bearish momentum.
- Williams %R (Willams %R): The Williams %R is in the oversold territory, indicating a possible reversal in the short term.
Volatility Analysis:
- Bollinger Bands (BB): The Bollinger Bands have been narrowing, suggesting decreasing volatility and a potential price breakout in the near future.
Volume Analysis:
- On-Balance Volume (OBV): The OBV has been negative, indicating selling pressure in the market.
- Chaikin Money Flow (CMF): The CMF has been negative, suggesting a lack of buying interest in the stock.
Key Observations:
- The stock is currently experiencing a consolidation phase with mixed signals from different indicators.
- The MACD Histogram and Williams %R indicate a possible reversal in the short term.
- The narrowing Bollinger Bands suggest an imminent price breakout.
- The negative OBV and CMF highlight the prevailing selling pressure in the market.
Conclusion:
Based on the technical analysis of the trend, momentum, volatility, and volume indicators, the stock price of INCY is likely to experience a short-term downward movement. Investors should exercise caution and consider waiting for more definitive signals before making any trading decisions. The current market conditions suggest a bearish outlook, and it is advisable to closely monitor the price action for potential entry or exit points.