Technical Analysis of LKQ 2024-05-10
Overview:
In analyzing the technical indicators for LKQ over the last 5 days, we will delve into the trend, momentum, volatility, and volume indicators to provide a comprehensive outlook on the possible stock price movement in the coming days. By examining these key indicators, we aim to offer valuable insights and predictions for informed decision-making.
Trend Analysis:
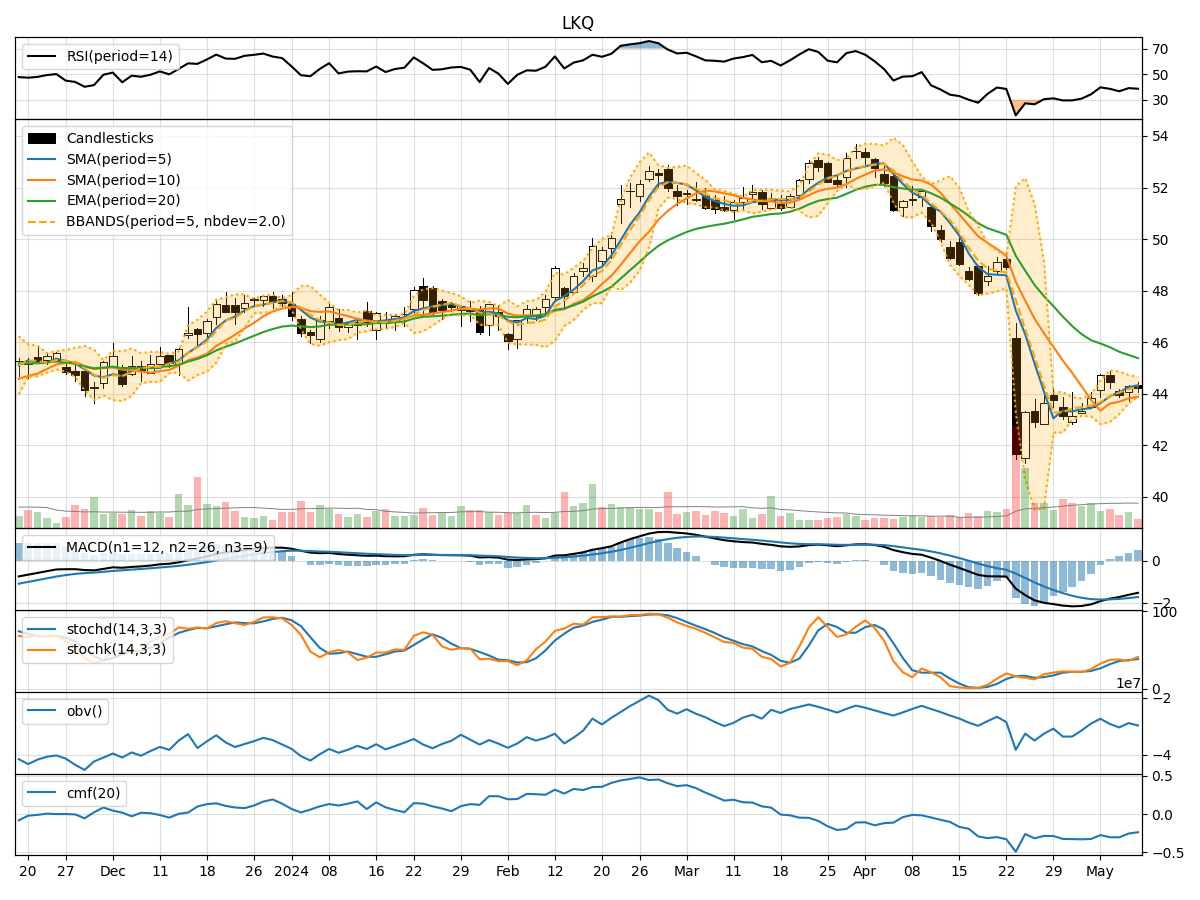
- Moving Averages (MA): The 5-day Moving Average (MA) has been showing a slight uptrend, indicating a potential support level for the stock price.
- MACD: The Moving Average Convergence Divergence (MACD) has been negative but showing signs of convergence, suggesting a possible trend reversal.
- EMA: The Exponential Moving Average (EMA) has been declining, indicating a bearish sentiment in the short term.
Momentum Analysis:
- RSI: The Relative Strength Index (RSI) has been hovering around the oversold territory, indicating a potential buying opportunity.
- Stochastic Oscillator: Both %K and %D have been rising, suggesting increasing buying momentum.
- Williams %R: The Williams %R is moving away from the oversold region, indicating a potential reversal in the stock price.
Volatility Analysis:
- Bollinger Bands: The Bollinger Bands are narrowing, indicating decreasing volatility and a possible period of consolidation.
- Bollinger %B: The %B is below 1, suggesting the stock is trading below the lower band, potentially indicating an oversold condition.
Volume Analysis:
- On-Balance Volume (OBV): The OBV has been fluctuating, indicating indecision among investors regarding the stock.
- Chaikin Money Flow (CMF): The CMF has been negative, suggesting outflow of money from the stock.
Key Observations and Opinions:
- Trend: The trend indicators show a mixed picture, with some signals of a potential reversal in the short term.
- Momentum: Momentum indicators suggest a possible shift towards buying pressure, indicating a bullish sentiment.
- Volatility: Volatility is decreasing, signaling a period of consolidation and potential stability in the stock price.
- Volume: Volume indicators reflect uncertainty and lack of strong conviction among investors.
Conclusion:
Based on the analysis of the technical indicators, the next few days for LKQ stock price movement could see a potential upward trend. The momentum indicators are showing signs of a bullish reversal, supported by narrowing volatility and a possible consolidation phase. However, investors should closely monitor the trend indicators for confirmation of a sustained uptrend. Consider setting appropriate stop-loss levels to manage risk effectively.