Technical Analysis of TXG 2024-05-10
Overview:
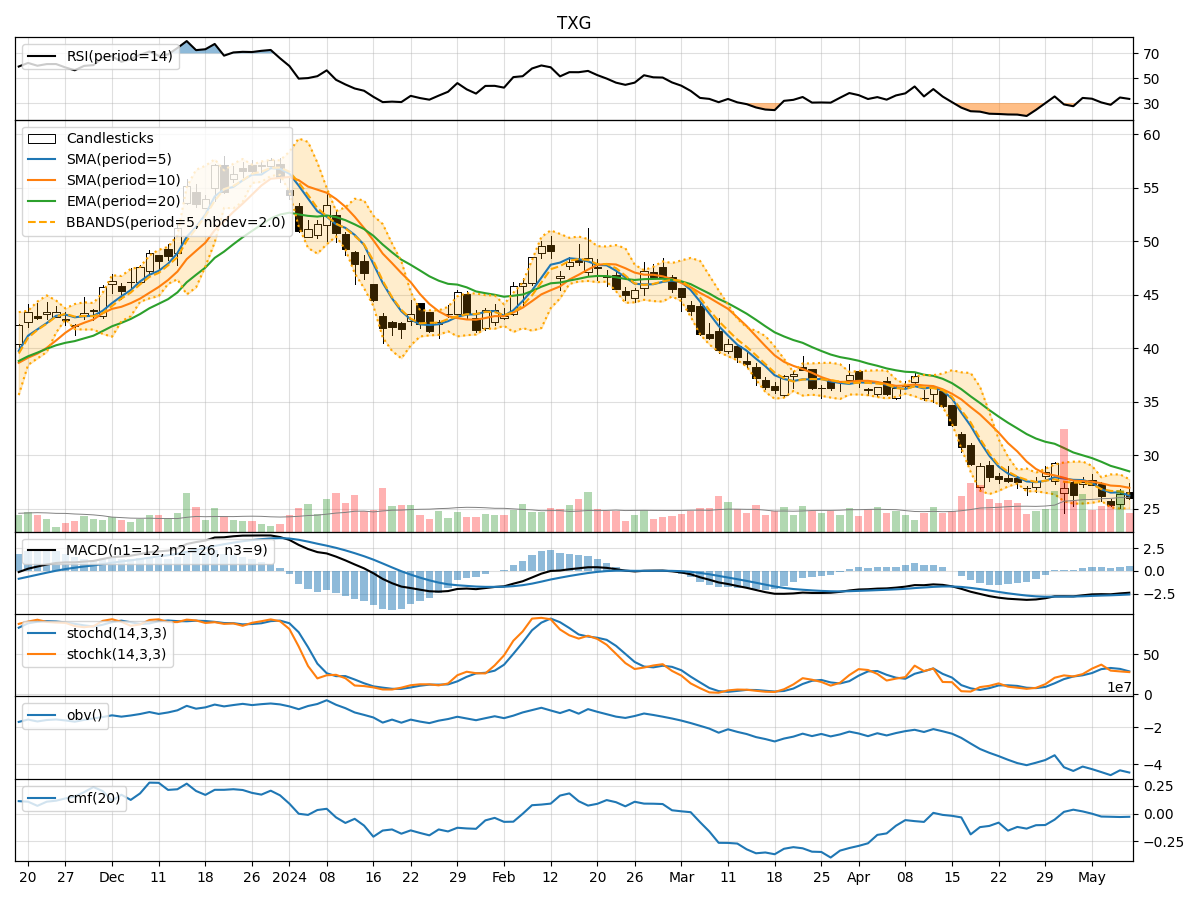
In analyzing the technical indicators for TXG over the last 5 days, we will delve into the trend, momentum, volatility, and volume indicators to provide a comprehensive outlook on the possible stock price movement in the coming days. By examining these key indicators, we aim to offer valuable insights and predictions to guide investment decisions.
Trend Indicators:
- Moving Averages (MA): The 5-day MA has been consistently below the closing prices, indicating a short-term downtrend.
- MACD: The MACD line has been negative, suggesting bearish momentum in the stock.
- EMA: The EMA has been declining, further supporting the bearish trend in the stock.
Key Observation: The trend indicators point towards a bearish outlook for TXG in the short term.
Momentum Indicators:
- RSI: The RSI has been relatively low, indicating oversold conditions in the stock.
- Stochastic Oscillator: Both %K and %D have been trending downwards, signaling weakening momentum.
- Williams %R: The indicator has been in the oversold territory, suggesting a potential reversal.
Key Observation: Momentum indicators reflect a bearish sentiment with signs of potential reversal due to oversold conditions.
Volatility Indicators:
- Bollinger Bands (BB): The stock price has been trading within the lower Bollinger Band, indicating lower volatility.
- Bollinger Band %B: The %B indicator has been below 0.2, suggesting the stock is oversold.
- Average True Range (ATR): ATR has been relatively low, indicating decreased volatility.
Key Observation: Volatility indicators signal a sideways movement with the potential for a reversal due to oversold conditions.
Volume Indicators:
- On-Balance Volume (OBV): The OBV has been declining, indicating selling pressure in the stock.
- Chaikin Money Flow (CMF): The CMF has been negative, suggesting outflow of money from the stock.
Key Observation: Volume indicators support the bearish sentiment with continued selling pressure.
Conclusion:
Based on the analysis of trend, momentum, volatility, and volume indicators, the overall outlook for TXG in the next few days is bearish with a potential for a reversal due to oversold conditions. Traders should exercise caution and consider waiting for confirmation of a trend reversal before considering long positions. Short-term traders may find opportunities to capitalize on potential price fluctuations, but the overall trend remains bearish.