Technical Analysis of HSBC 2024-05-10
Overview:
In analyzing the technical indicators for HSBC over the last 5 days, we will delve into the trend, momentum, volatility, and volume indicators to provide a comprehensive outlook on the possible stock price movement in the coming days. By examining these key indicators, we aim to offer valuable insights and predictions to guide investment decisions.
Trend Analysis:
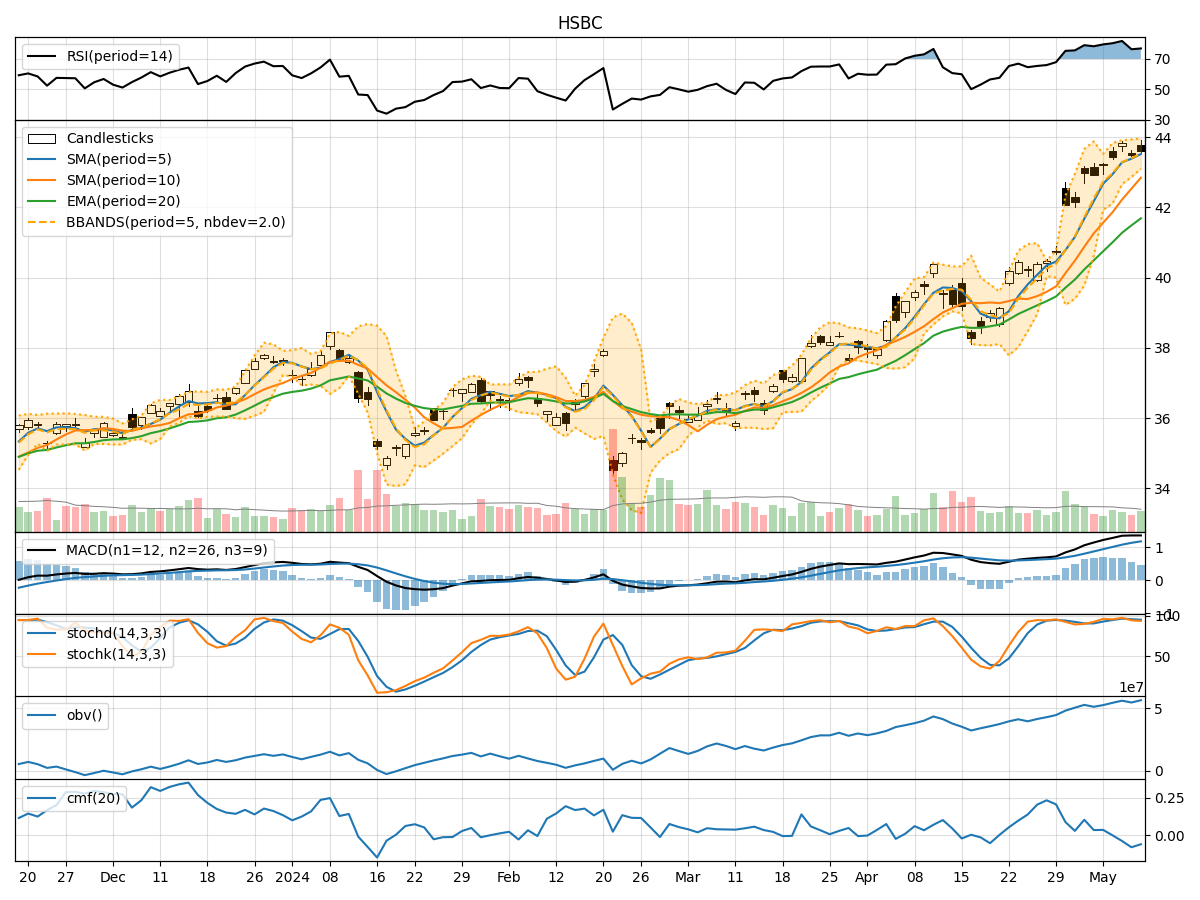
- Moving Averages (MA): The 5-day Moving Average (MA) has been consistently above the longer-term Simple Moving Average (SMA) and Exponential Moving Average (EMA), indicating a bullish trend.
- MACD: The Moving Average Convergence Divergence (MACD) has shown positive values, with the MACD line consistently above the Signal line, suggesting bullish momentum.
Momentum Analysis:
- RSI: The Relative Strength Index (RSI) has been in the overbought territory, indicating a strong bullish momentum.
- Stochastic Oscillator: Both %K and %D have been relatively high, signaling an overbought condition.
Volatility Analysis:
- Bollinger Bands (BB): The stock price has been trading within the Bollinger Bands, with the bands widening slightly, indicating increased volatility.
Volume Analysis:
- On-Balance Volume (OBV): The OBV has shown a mixed trend, with some days seeing positive volume accumulation and others experiencing distribution.
- Chaikin Money Flow (CMF): The CMF has been negative, suggesting selling pressure in the stock.
Key Observations:
- The trend indicators suggest a strong bullish sentiment, supported by the moving averages and MACD.
- Momentum indicators indicate an overbought condition, potentially signaling a short-term correction.
- Volatility has increased slightly, which could lead to larger price swings in the coming days.
- Volume indicators show mixed signals, with some days indicating buying interest and others showing selling pressure.
Conclusion:
Based on the analysis of the technical indicators, the stock price of HSBC is likely to experience a short-term correction due to the overbought momentum and negative CMF. However, the overall trend remains bullish, supported by the moving averages and MACD. Traders should be cautious of potential price swings due to increased volatility. It is advisable to monitor the price action closely for signs of a reversal or continuation of the current uptrend.
Recommendation:
- Short-term traders: Consider taking profits or implementing risk management strategies to protect gains during the expected correction.
- Long-term investors: Hold positions but remain vigilant for potential buying opportunities during the correction phase.
By combining technical analysis with market insights, investors can make informed decisions aligned with the current market dynamics and maximize their returns.