Technical Analysis of XPEV 2024-05-10
Overview:
In analyzing the technical indicators for XPEV over the last 5 days, we will delve into the trend, momentum, volatility, and volume indicators to provide a comprehensive outlook on the possible stock price movement. By examining these key aspects, we aim to offer valuable insights and predictions for the upcoming days.
Trend Analysis:
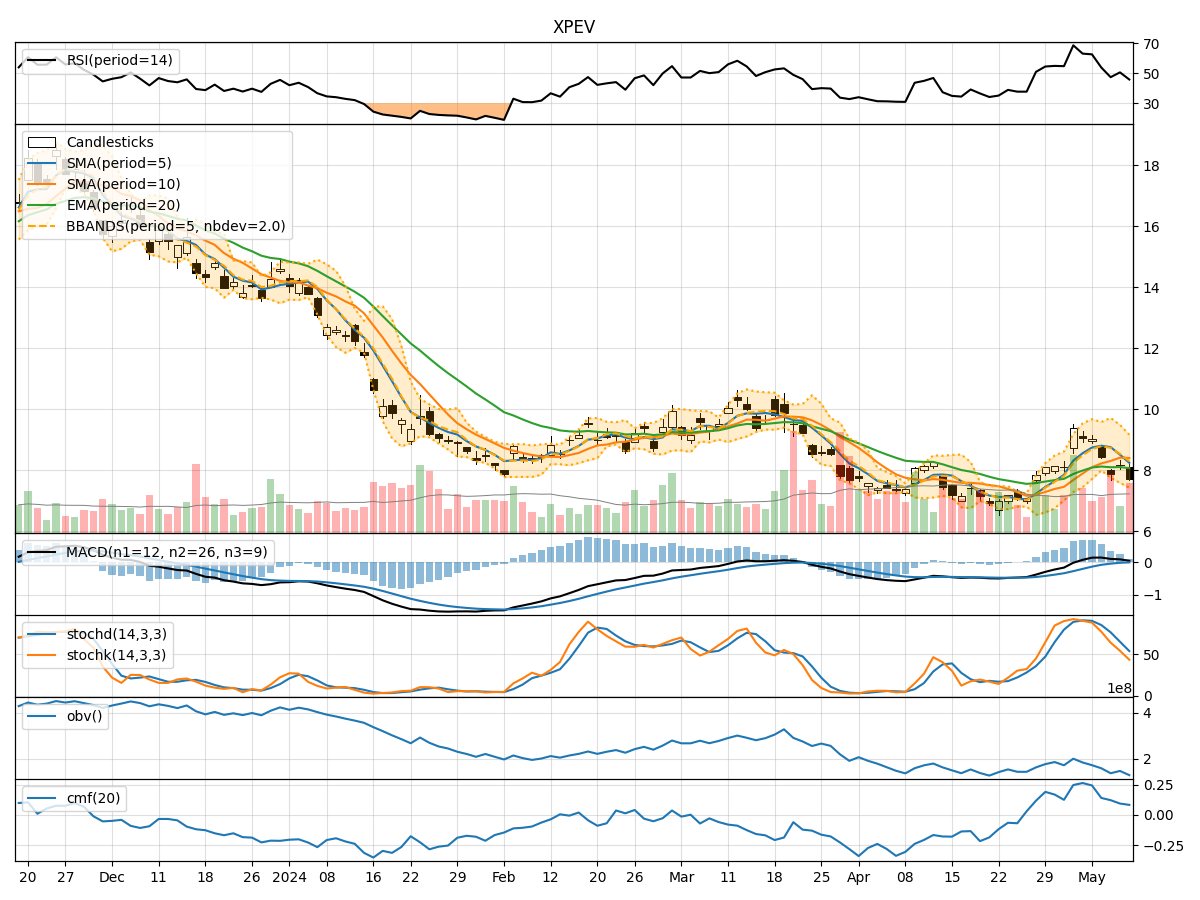
- Moving Averages (MA): The 5-day Moving Average (MA) has been fluctuating around the closing prices, indicating short-term price trends. The Simple Moving Average (SMA) and Exponential Moving Average (EMA) show a similar pattern, with slight variations.
- MACD: The Moving Average Convergence Divergence (MACD) has been positive but decreasing, suggesting a potential slowdown in the bullish momentum.
- Conclusion: The trend indicators suggest a neutral to slightly bearish outlook in the short term.
Momentum Analysis:
- RSI: The Relative Strength Index (RSI) has been oscillating around the mid-level, indicating a balanced momentum between buying and selling pressure.
- Stochastic Oscillator: Both %K and %D values have been declining, pointing towards a weakening momentum.
- Conclusion: The momentum indicators signal a neutral to bearish sentiment in the near future.
Volatility Analysis:
- Bollinger Bands (BB): The Bollinger Bands have been narrowing, indicating decreasing volatility in the stock price.
- Conclusion: Volatility indicators suggest a consolidation phase or a period of reduced price fluctuations.
Volume Analysis:
- On-Balance Volume (OBV): The OBV has been consistently negative, reflecting higher selling volume compared to buying volume.
- Chaikin Money Flow (CMF): The CMF has been positive but declining, indicating a decrease in buying pressure.
- Conclusion: Volume indicators point towards a bearish sentiment with higher selling pressure.
Overall Conclusion:
Based on the analysis of trend, momentum, volatility, and volume indicators, the next few days for XPEV are likely to see a downward movement. The trend indicators suggest a potential slowdown in the bullish momentum, while momentum and volume indicators indicate a bearish sentiment. The decreasing volatility also aligns with a consolidation phase or a period of reduced price fluctuations. Therefore, investors should exercise caution and consider potential short-term downside risks in their trading strategies.
Key Recommendations:
- Monitor Price Action: Keep a close eye on how the stock price reacts to key support levels in the coming days.
- Risk Management: Implement proper risk management strategies to protect against potential downside risks.
- Wait for Confirmation: Consider waiting for confirmation of a trend reversal before considering long positions.
By combining insights from various technical indicators, investors can make more informed decisions and adapt their strategies to the evolving market conditions.