Unleash the Power of Stock Analysis with InvestGPT’s Cutting-Edge Charting Features
Introduction
In the fast-paced world of investing, having access to powerful tools that simplify complex data analysis is crucial. Kavout, a leading provider of investment technology, has just launched a new feature in their flagship product, InvestGPT. This innovative update promises to revolutionize the way investors analyze and visualize stock data, making it easier than ever to make informed decisions.
Effortless Stock Charting
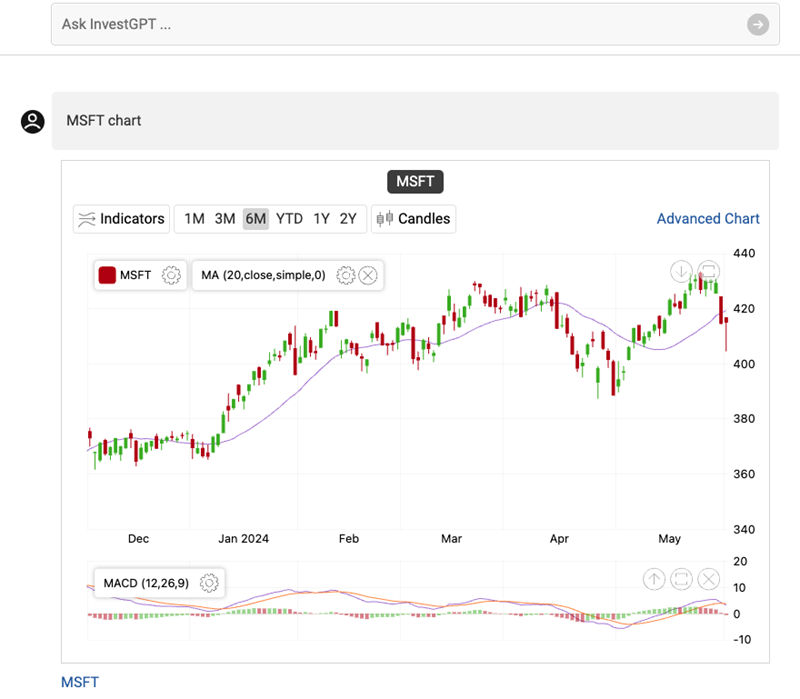
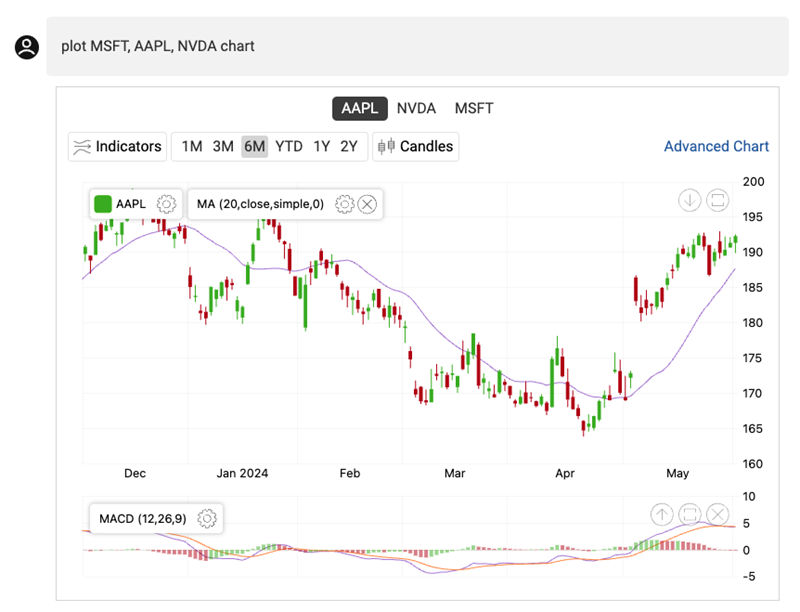
With InvestGPT’s cutting-edge stock charting capabilities, users can now effortlessly plot candlestick charts, line charts, and enhance their technical analysis with a wide range of indicators. Accessing these features is a breeze, thanks to the platform’s intuitive natural language commands. Simply type “plot chart for MSFT” or “MSFT chart” to instantly generate a chart for Microsoft stock. Comparing multiple stocks on the same chart is just as easy – enter “MSFT, AMD, AMZN chart” or “plot MSFT, AAPL, NVDA chart” to view them all together.
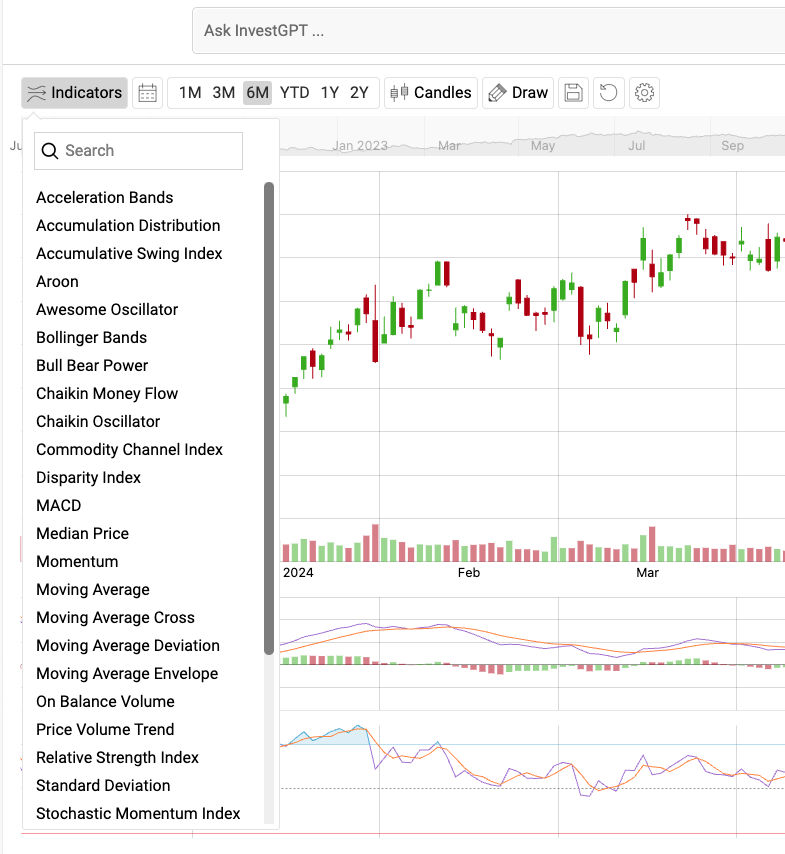
Advanced Technical Analysis
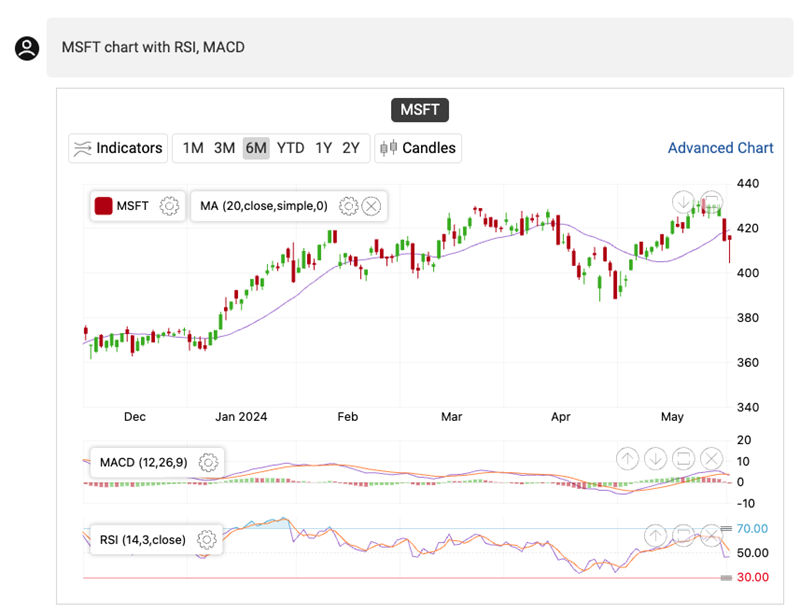
InvestGPT takes technical analysis to the next level by allowing users to seamlessly incorporate a variety of indicators into their charts. Include the desired indicators in your command, such as “MSFT chart with RSI, MACD” or “MSFT chart with moving averages, volume,” and InvestGPT will do the rest. Users can even modify the parameters of these indicators directly on the chart and add new ones as needed, providing unparalleled flexibility and customization.
Immersive Full-Screen Experience
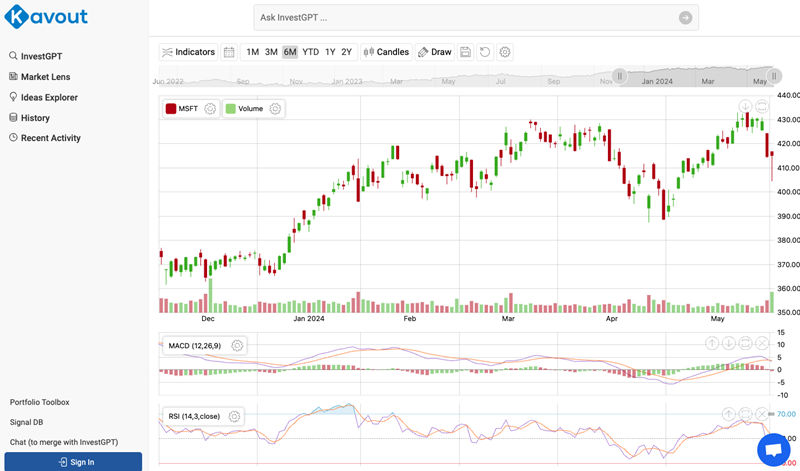
For those seeking an even more immersive experience, InvestGPT offers an advanced charting feature. Simply click on the “Advanced Chart” link in the top right corner of any chart to open a full-screen view, complete with dozens of additional indicators. From there, users can easily download or save the chart as an image for future reference, making it simple to share insights with colleagues or clients.
Seamless Integration and Ease of Use
One of the most impressive aspects of InvestGPT’s new stock charting features is their seamless integration into the platform’s existing natural language command interface. This empowers users to analyze charts using simple, intuitive commands, gaining valuable insights and making informed investment decisions with unparalleled ease.
Examples:
msft chart
plot msft aapl charts
msft amd chart with rsi
Conclusion
Kavout’s commitment to providing users with the most advanced and user-friendly tools to navigate the financial markets is evident in InvestGPT’s latest update. By introducing these powerful stock charting features, Kavout has once again demonstrated its dedication to staying at the forefront of investment technology. As investors begin to explore these exciting new capabilities, they can look forward to unlocking the full potential of their investment strategies and staying ahead of the curve in an ever-evolving financial landscape.
Send us a Message
Contact us
Contact us today to learn more about Kavout's products or services.