Technical Analysis of BOIL 2024-05-31
Overview:
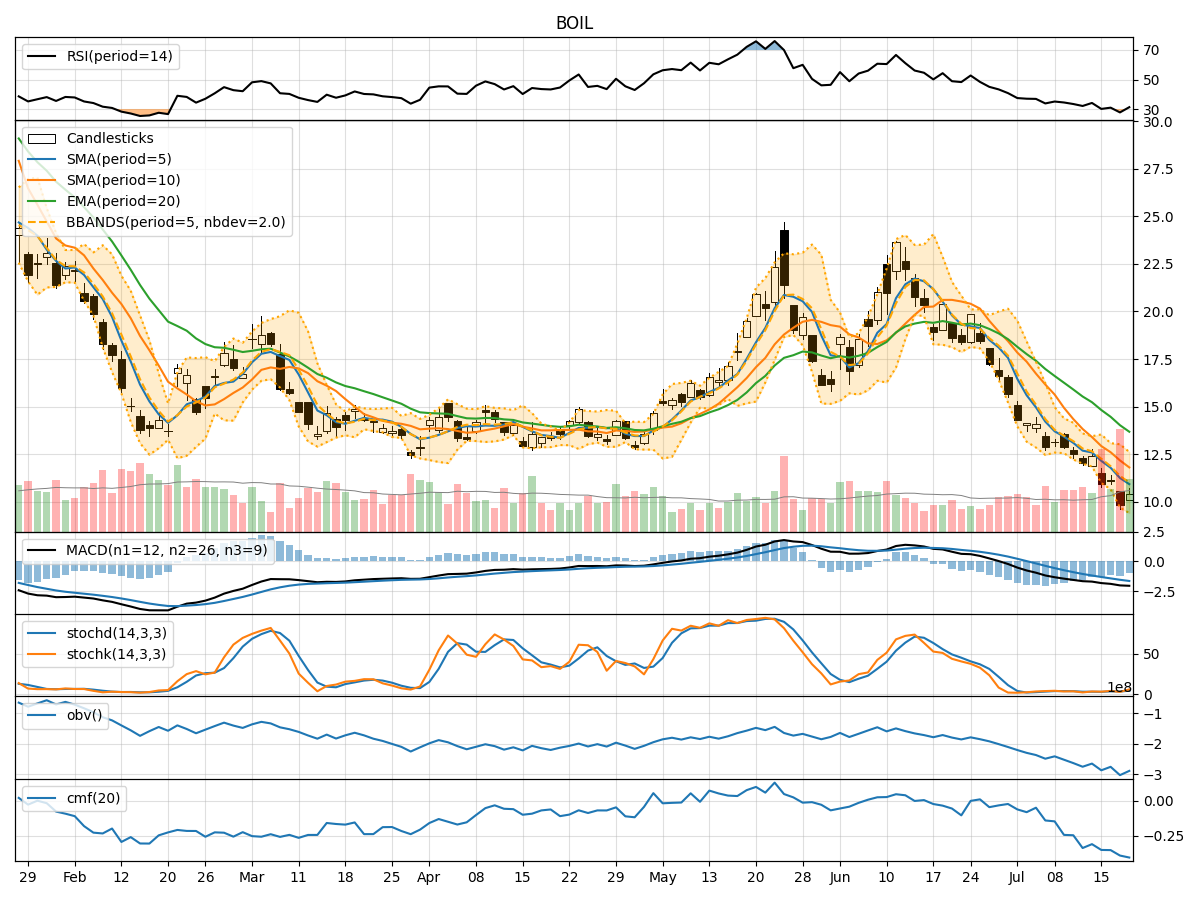
In analyzing the technical indicators for BOIL over the last 5 days, we will delve into the trend, momentum, volatility, and volume indicators to provide a comprehensive outlook on the possible stock price movement in the coming days. By examining these key aspects, we aim to offer valuable insights and predictions for potential investors.
Trend Indicators:
- Moving Averages (MA): The 5-day moving average has been consistently below the closing prices, indicating a short-term downtrend.
- MACD: The MACD line has been decreasing, with the MACD histogram also showing a decline, suggesting a weakening bullish momentum.
Momentum Indicators:
- RSI: The RSI has been declining, indicating a decrease in buying pressure and potential oversold conditions.
- Stochastic Oscillator: Both %K and %D have been decreasing, signaling a bearish momentum.
Volatility Indicators:
- Bollinger Bands (BB): The stock price has been consistently below the middle Bollinger Band, indicating a downward trend.
Volume Indicators:
- On-Balance Volume (OBV): The OBV has been consistently negative, suggesting a higher selling volume compared to buying volume.
- Chaikin Money Flow (CMF): The CMF has been negative, indicating a bearish money flow.
Key Observations and Opinions:
- Trend: The trend indicators suggest a bearish sentiment in the short term.
- Momentum: Momentum indicators confirm the bearish outlook with decreasing RSI and Stochastic values.
- Volatility: Volatility indicators show a downward trend with the stock price consistently below the middle Bollinger Band.
- Volume: Negative OBV and CMF values indicate higher selling pressure and bearish sentiment.
Conclusion:
Based on the analysis of the technical indicators, the next few days' possible stock price movement for BOIL is likely to continue on a downward trajectory. The bearish trend, supported by weakening momentum, negative volume indicators, and consistent low volatility, suggests that investors should exercise caution and consider potential short positions or wait for a more favorable entry point. It is advisable to closely monitor the indicators for any signs of a trend reversal before considering long positions.