Technical Analysis of BWZ 2024-05-31
Overview:
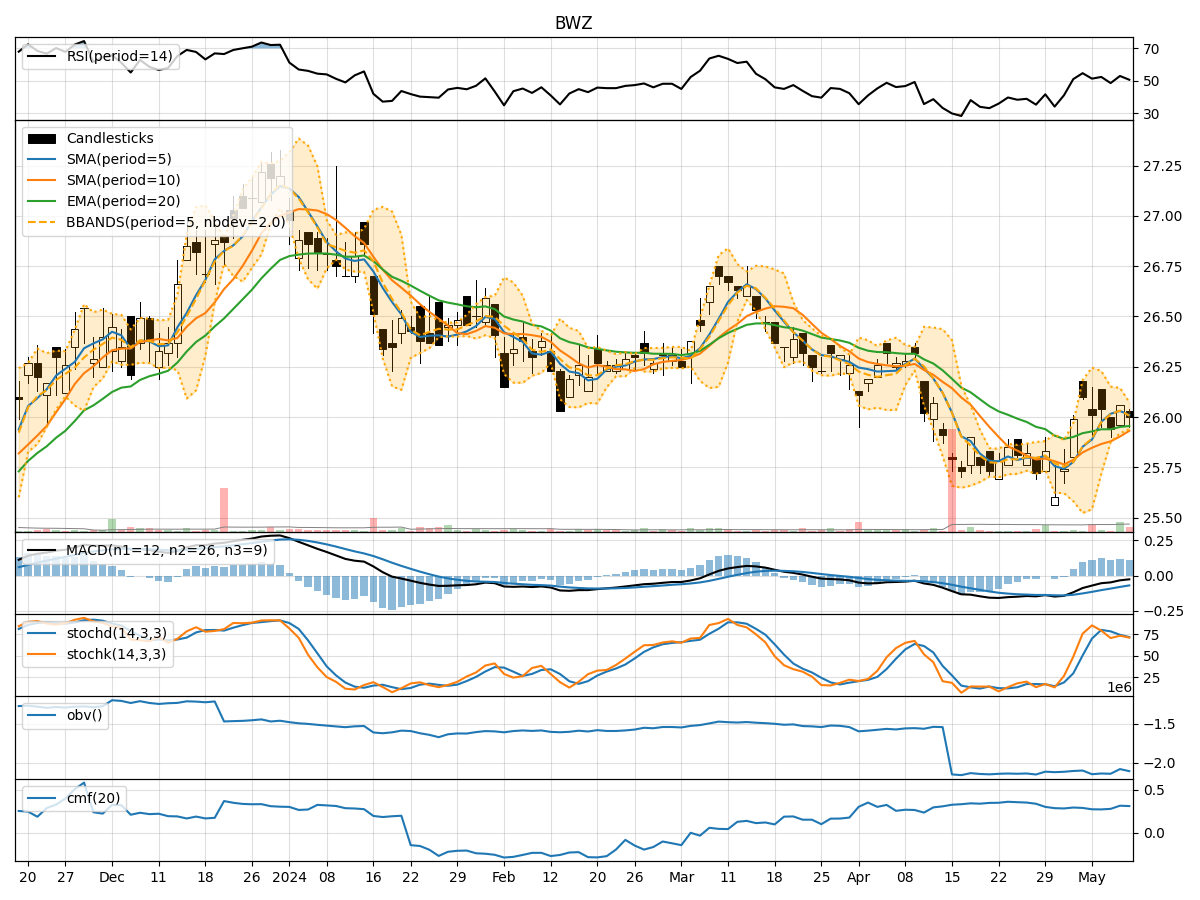
In analyzing the technical indicators for BWZ stock over the last 5 days, we will delve into the trends, momentum, volatility, and volume aspects to provide a comprehensive outlook on the possible future stock price movement. By examining key indicators such as moving averages, MACD, RSI, Bollinger Bands, and OBV, we aim to offer valuable insights and predictions for the upcoming trading days.
Trend Analysis:
- Moving Averages (MA): The 5-day MA has been hovering around the closing prices, indicating a relatively stable trend.
- MACD: The MACD line has been consistently positive, albeit showing a slight decrease over the days.
- EMA: The EMA has been relatively flat, suggesting a lack of strong directional momentum.
Momentum Analysis:
- RSI: The RSI values have been fluctuating around the mid-range, indicating a balanced momentum without extreme overbought or oversold conditions.
- Stochastic Oscillator: Both %K and %D values have been declining, signaling a potential weakening momentum.
- Williams %R: The Williams %R values have been in the oversold territory, indicating a possible reversal in momentum.
Volatility Analysis:
- Bollinger Bands: The stock price has been trading within the Bollinger Bands, with the bands narrowing slightly over the days.
- Bollinger %B: The %B values have been relatively stable, suggesting a lack of significant volatility.
Volume Analysis:
- On-Balance Volume (OBV): The OBV values have been fluctuating, indicating mixed buying and selling pressure.
- Chaikin Money Flow (CMF): The CMF values have been positive, suggesting a net inflow of money into the stock.
Key Observations:
- The stock is currently in a sideways consolidation phase, with no clear trend direction.
- Momentum is showing signs of weakness as indicated by declining stochastic values and oversold Williams %R.
- Volatility remains low as the Bollinger Bands are narrowing.
- Volume indicators suggest mixed sentiment with fluctuating OBV and positive CMF values.
Conclusion:
Based on the analysis of the technical indicators, the next few days for BWZ stock are likely to see continued sideways movement with limited volatility. The weakening momentum and lack of clear trend direction suggest that the stock may consolidate further before a potential breakout. Traders should exercise caution and wait for clearer signals before making significant trading decisions.