Technical Analysis of DJAN 2024-05-31
Overview:
In analyzing the technical indicators for DJAN stock over the last 5 days, we will delve into the trend, momentum, volatility, and volume indicators to provide a comprehensive outlook on the possible stock price movement in the coming days. By examining these key indicators, we aim to offer valuable insights and predictions to guide investment decisions.
Trend Indicators:
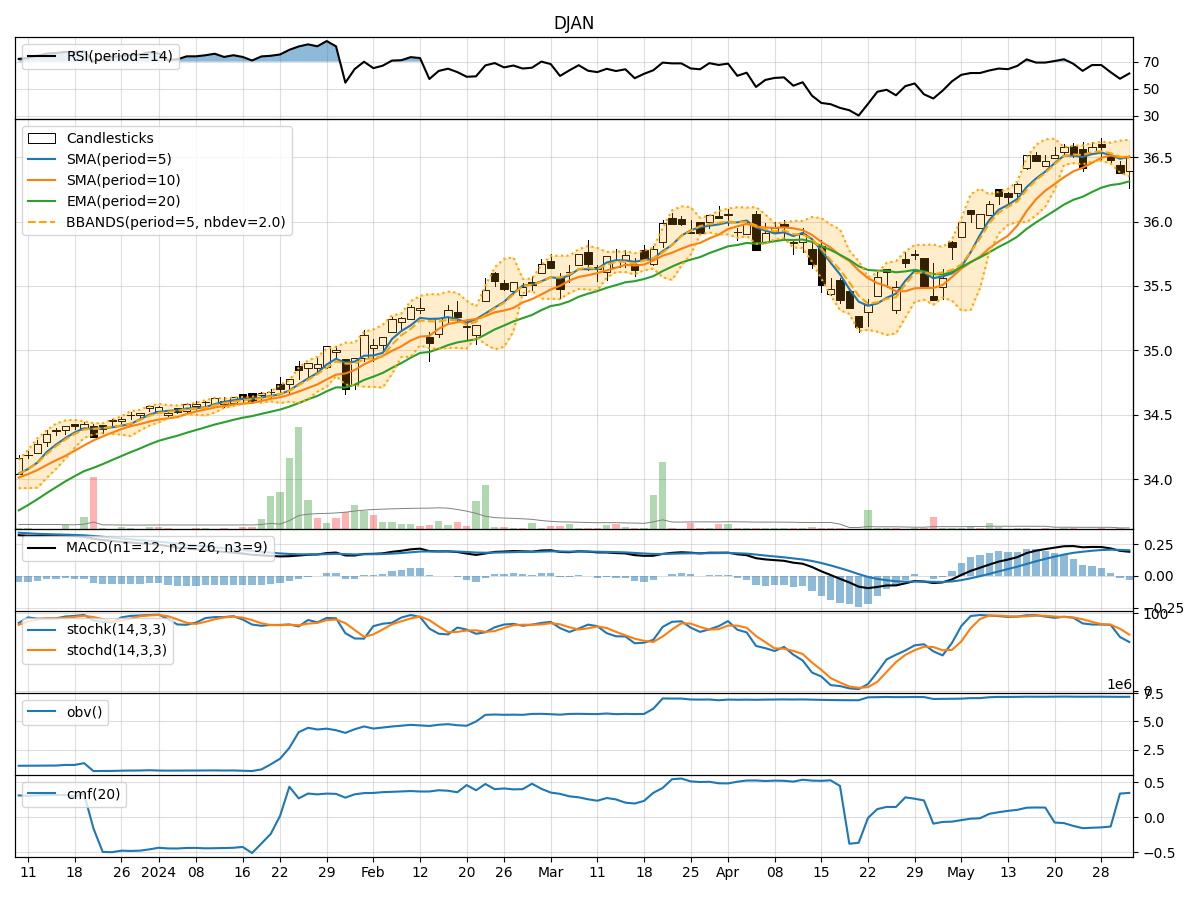
- Moving Averages (MA): The 5-day Moving Average (MA) has been relatively stable around the current price levels, indicating a short-term equilibrium.
- MACD: The Moving Average Convergence Divergence (MACD) has shown a slight positive trend, suggesting a potential bullish momentum.
- EMA: The Exponential Moving Average (EMA) has been gradually increasing, reflecting a positive price trend.
Momentum Indicators:
- RSI: The Relative Strength Index (RSI) has been fluctuating in the neutral zone, indicating a balanced momentum.
- Stochastic Oscillator: Both %K and %D have been declining, signaling a potential bearish momentum.
- Williams %R: The Williams %R is in the oversold territory, suggesting a possible reversal in the short term.
Volatility Indicators:
- Bollinger Bands: The Bollinger Bands have been narrowing, indicating decreasing volatility and a potential price breakout.
- Bollinger %B: The %B indicator has been fluctuating within a tight range, suggesting a period of consolidation.
Volume Indicators:
- On-Balance Volume (OBV): The OBV has shown mixed signals, reflecting indecision among market participants.
- Chaikin Money Flow (CMF): The CMF has been positive, indicating buying pressure in the market.
Key Observations:
- The trend indicators suggest a potential bullish bias in the short term.
- Momentum indicators show a mixed picture with a slight bearish bias.
- Volatility indicators point towards a period of consolidation and a potential breakout.
- Volume indicators reflect indecision but with a slight buying pressure.
Conclusion:
Based on the analysis of the technical indicators, the next few days for DJAN stock could see sideways consolidation with a slight bullish bias. Traders should monitor key levels for potential breakout opportunities. It is advisable to wait for confirmation signals before taking significant trading positions.