Technical Analysis of DRV 2024-05-31
Overview:
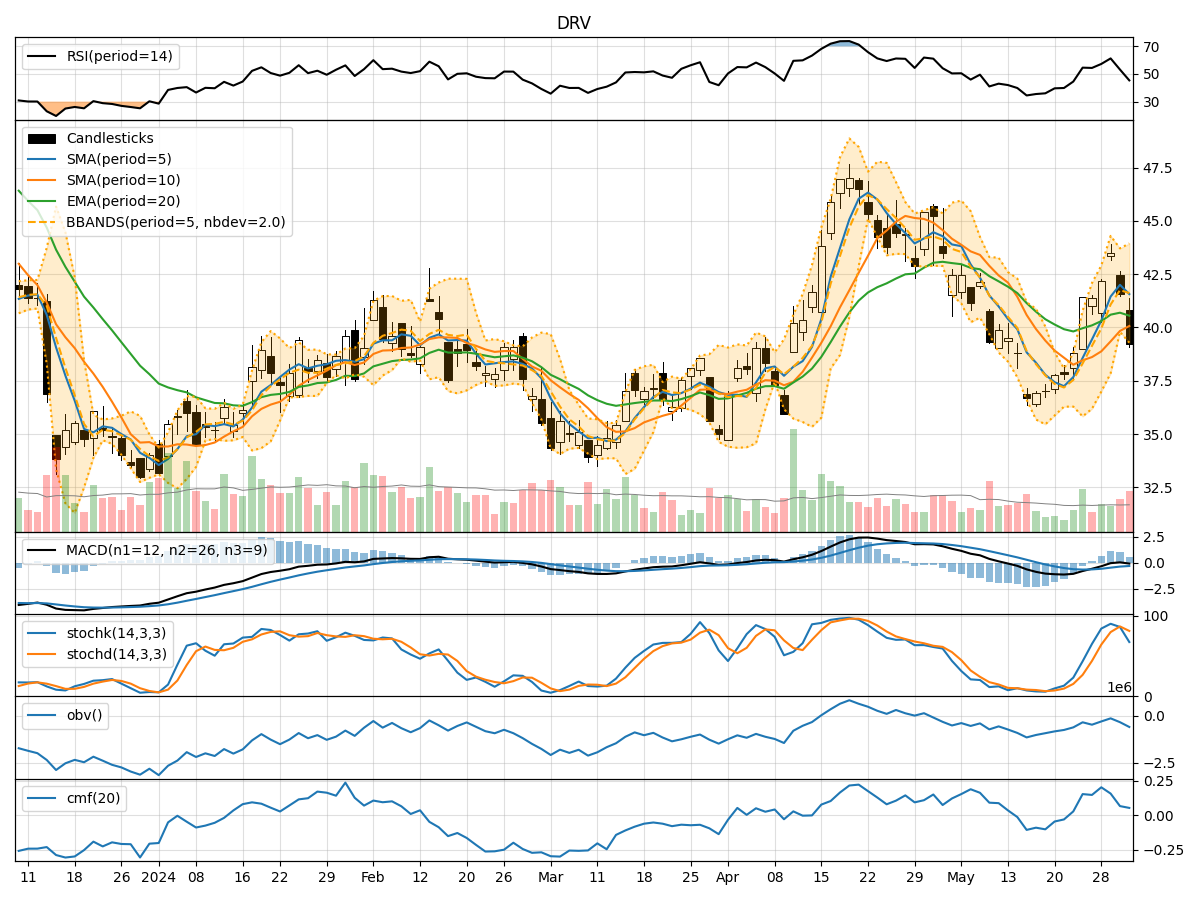
In analyzing the technical indicators for DRV over the last 5 days, we will delve into the trend, momentum, volatility, and volume indicators to provide a comprehensive outlook on the possible stock price movement in the coming days.
Trend Analysis:
- Moving Averages (MA): The 5-day Moving Average has been consistently increasing, indicating a bullish trend in the short term.
- MACD: The MACD line has been positive, suggesting upward momentum in the stock price.
- RSI: The Relative Strength Index has been fluctuating but generally staying within the neutral range, indicating a balanced market sentiment.
Momentum Analysis:
- Stochastic Oscillator: The Stochastic Oscillator has shown fluctuations but has been mostly in the overbought territory, signaling potential for a pullback.
- Williams %R: The Williams %R indicator has been in the oversold region, suggesting a possible reversal in the stock price.
Volatility Analysis:
- Bollinger Bands: The Bollinger Bands have shown widening in the recent days, indicating increased volatility in the stock price.
- Average True Range (ATR): The ATR has been relatively high, suggesting significant price movements in the stock.
Volume Analysis:
- On-Balance Volume (OBV): The OBV has shown mixed signals, indicating indecision among investors regarding the stock.
- Chaikin Money Flow (CMF): The CMF has been positive but decreasing, suggesting a potential outflow of money from the stock.
Key Observations:
- The trend indicators point towards a bullish sentiment in the short term.
- Momentum indicators suggest a possible pullback or reversal in the stock price.
- Volatility indicators indicate increased price fluctuations and uncertainty.
- Volume indicators show mixed signals, reflecting investor indecision.
Conclusion:
Based on the analysis of the technical indicators, the next few days' possible stock price movement for DRV is likely to experience a period of consolidation. The bullish trend indicated by moving averages and MACD may face resistance due to overbought conditions highlighted by the Stochastic Oscillator and Williams %R. The increased volatility and mixed volume signals further support the view of a sideways movement in the stock price.
Recommendation:
- Short-term Traders: Consider taking profits or tightening stop-loss levels due to the potential for a pullback.
- Long-term Investors: Monitor the price action closely for a clearer trend confirmation before making significant decisions.
By carefully considering the interplay of trend, momentum, volatility, and volume indicators, investors can make informed decisions aligned with the current market dynamics.