Technical Analysis of EDOG 2024-05-31
Overview:
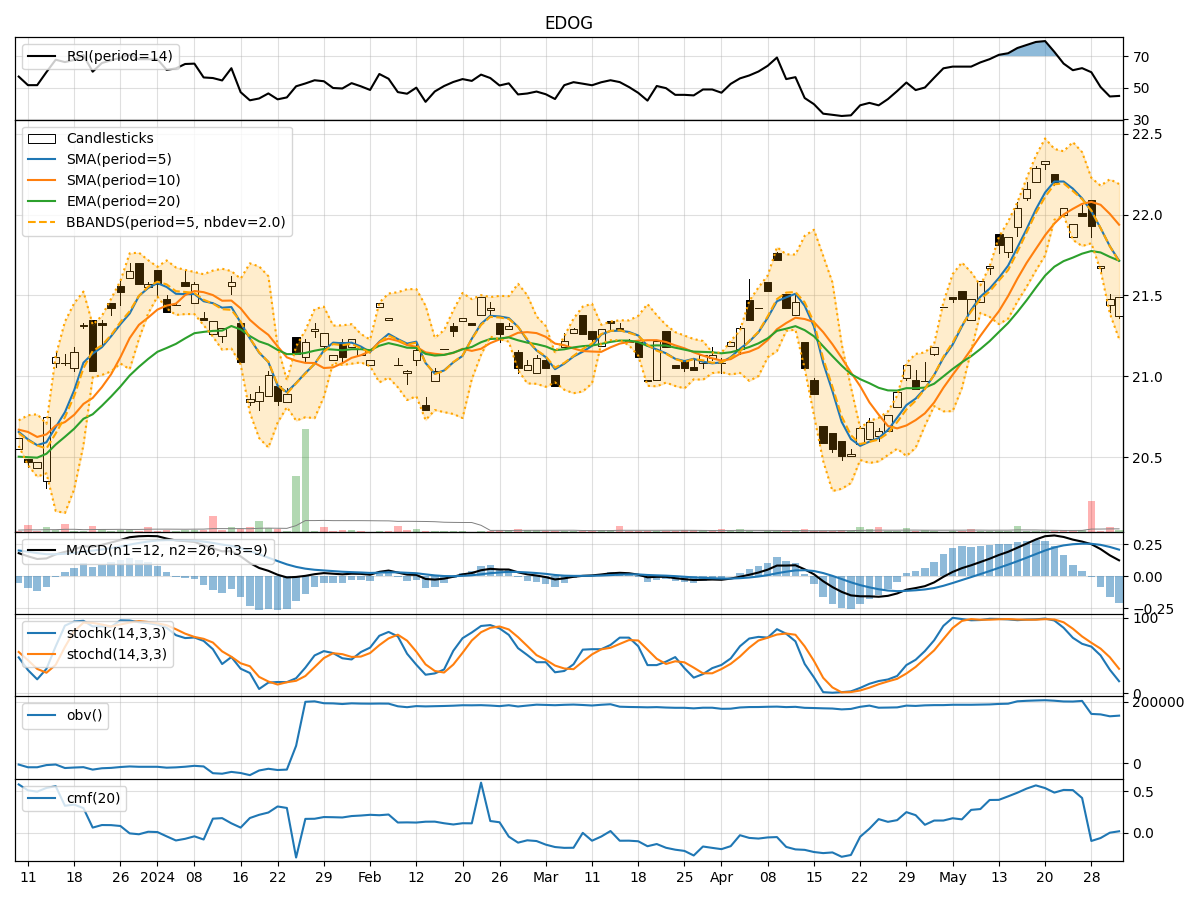
In analyzing the technical indicators for EDOG stock over the last 5 days, we will delve into the trend, momentum, volatility, and volume indicators to provide a comprehensive outlook on the possible stock price movement in the coming days. By examining these key indicators, we aim to offer valuable insights and predictions to guide investment decisions.
Trend Indicators:
- Moving Averages (MA): The 5-day moving average has been consistently below the closing prices, indicating a short-term downtrend.
- MACD: The MACD line has been positive but decreasing, while the MACD histogram has been in negative territory, suggesting a weakening bullish momentum.
- EMA: The exponential moving average has been below the closing prices, reflecting a bearish sentiment.
Momentum Indicators:
- RSI: The Relative Strength Index has been declining, indicating a loss of bullish momentum.
- Stochastic Oscillator: Both %K and %D have been decreasing, signaling a potential oversold condition.
- Williams %R: The indicator has been in oversold territory, suggesting a possible reversal.
Volatility Indicators:
- Bollinger Bands: The stock price has been trading within the lower Bollinger Band, indicating a period of low volatility.
- Bollinger %B: The %B indicator has been below 0.2, suggesting the stock is oversold.
Volume Indicators:
- On-Balance Volume (OBV): The OBV has been declining, indicating selling pressure.
- Chaikin Money Flow (CMF): The CMF has been negative, reflecting a bearish money flow.
Key Observations and Opinions:
- Trend: The trend indicators suggest a bearish sentiment in the short term.
- Momentum: Momentum indicators point towards a weakening bullish momentum and a potential reversal.
- Volatility: Low volatility indicates a period of consolidation or a potential breakout.
- Volume: Declining OBV and negative CMF indicate bearish sentiment and selling pressure.
Conclusion:
Based on the analysis of the technical indicators, the next few days' possible stock price movement for EDOG is likely to be downward. The bearish trend, weakening momentum, oversold conditions, low volatility, and negative volume indicators all point towards a potential further decline in the stock price. Traders and investors should exercise caution and consider shorting or selling positions in anticipation of a downward movement in the stock price.