Technical Analysis of FTC 2024-05-31
Overview:
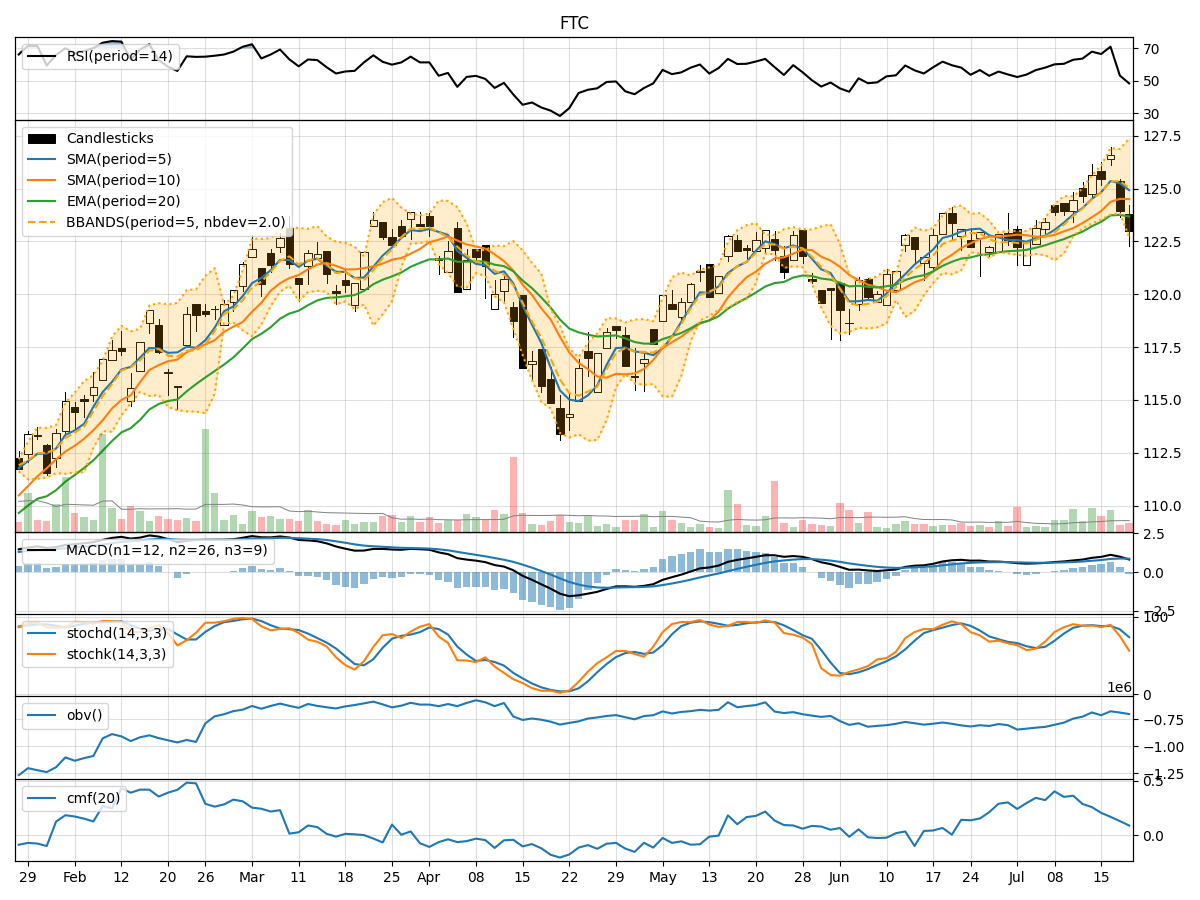
In analyzing the technical indicators for FTC over the last 5 days, we will delve into the trend, momentum, volatility, and volume indicators to provide a comprehensive outlook on the possible stock price movement in the coming days.
Trend Analysis:
- Moving Averages (MA): The 5-day Moving Average (MA) has been declining steadily, indicating a short-term bearish trend.
- MACD: The MACD line has been decreasing, and the MACD Histogram is also in negative territory, suggesting a bearish momentum.
- EMA: The Exponential Moving Average (EMA) has been trending downwards, aligning with the bearish sentiment in the short term.
Momentum Analysis:
- RSI: The Relative Strength Index (RSI) has been decreasing, indicating weakening momentum.
- Stochastic Oscillator: Both %K and %D of the Stochastic Oscillator are in oversold territory, signaling a potential reversal or consolidation.
- Williams %R: The Williams %R is also in oversold territory, suggesting a possible bounce back in the near future.
Volatility Analysis:
- Bollinger Bands: The Bollinger Bands are widening, indicating increased volatility in the stock price.
- Bollinger %B: The %B indicator is below 0.2, suggesting the stock is oversold and may see a reversal soon.
Volume Analysis:
- On-Balance Volume (OBV): The OBV has been declining, indicating distribution and potential selling pressure.
- Chaikin Money Flow (CMF): The CMF is positive but decreasing, signaling a potential decrease in buying pressure.
Key Observations:
- The trend indicators, momentum indicators, and volume indicators all point towards a bearish sentiment in the short term.
- The volatility indicators suggest increased price fluctuations, which could lead to potential trading opportunities.
- The oversold conditions in the momentum indicators indicate a possible reversal or consolidation in the near future.
Conclusion:
Based on the analysis of the technical indicators, the next few days' possible stock price movement for FTC is likely to be bearish in the short term. Traders should exercise caution and consider waiting for confirmation of a trend reversal before considering long positions. The increased volatility may present short-term trading opportunities, but the overall trend remains bearish.