Technical Analysis of FXY 2024-05-31
Overview:
In analyzing the technical indicators for FXY over the last 5 days, we will delve into the trend, momentum, volatility, and volume indicators to provide a comprehensive outlook on the possible stock price movement in the coming days. By examining these key aspects, we aim to offer valuable insights and predictions for potential investors.
Trend Indicators:
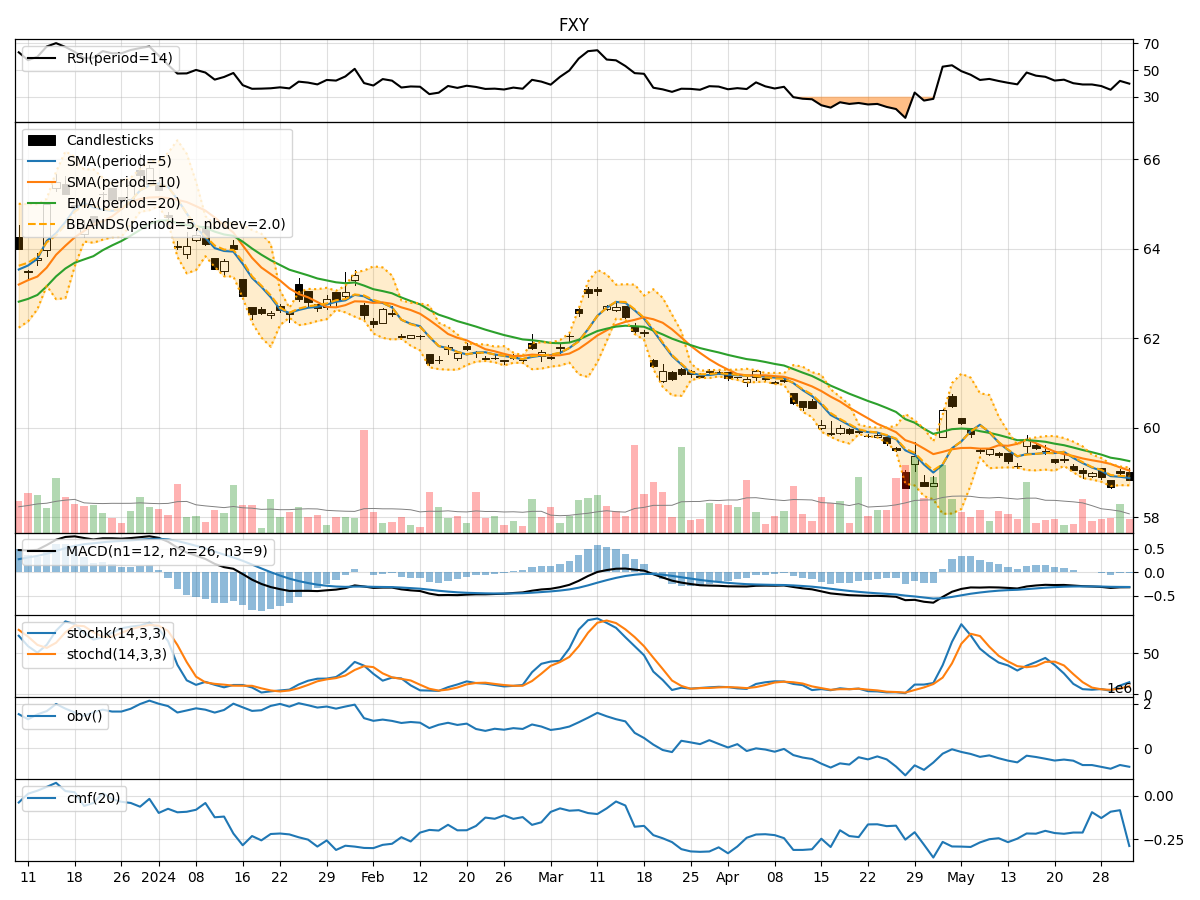
- Moving Averages (MA): The 5-day MA has been consistently below the closing prices, indicating a short-term downtrend.
- MACD: The MACD line has been below the signal line, suggesting bearish momentum.
- EMA: The exponential moving average has been declining, further supporting the bearish trend.
Momentum Indicators:
- RSI: The RSI has been relatively low, indicating oversold conditions.
- Stochastic Oscillator: Both %K and %D have been in the oversold territory, signaling a potential reversal.
- Williams %R: The indicator has been deeply oversold, suggesting a possible bounce back.
Volatility Indicators:
- Bollinger Bands: The bands have been narrowing, indicating decreasing volatility.
- Bollinger %B: The %B has been fluctuating within a tight range, reflecting consolidation.
- Average True Range (ATR): The ATR has been relatively stable, suggesting a lack of significant price movements.
Volume Indicators:
- On-Balance Volume (OBV): The OBV has been declining, indicating selling pressure.
- Chaikin Money Flow (CMF): The CMF has been negative, reflecting outflow of money from the stock.
Key Observations and Opinions:
- Trend: The trend indicators suggest a bearish sentiment in the short term.
- Momentum: Momentum indicators point towards a potential reversal from oversold levels.
- Volatility: Volatility indicators indicate a period of consolidation and stability.
- Volume: Volume indicators show a decrease in buying interest and selling pressure.
Conclusion:
Based on the analysis of the technical indicators, the next few days for FXY are likely to see sideways movement with a potential for a bullish reversal. Traders should closely monitor the momentum indicators for signs of a trend reversal and consider the decreasing volatility as a precursor to a possible breakout. However, it is essential to exercise caution and wait for confirmation signals before making any trading decisions.