Technical Analysis of GCC 2024-05-31
Overview:
In analyzing the technical indicators for GCC stock over the last 5 days, we will delve into the trend, momentum, volatility, and volume indicators to provide a comprehensive outlook on the possible stock price movement in the upcoming days. By examining these key indicators, we aim to offer valuable insights and predictions for informed decision-making.
Trend Analysis:
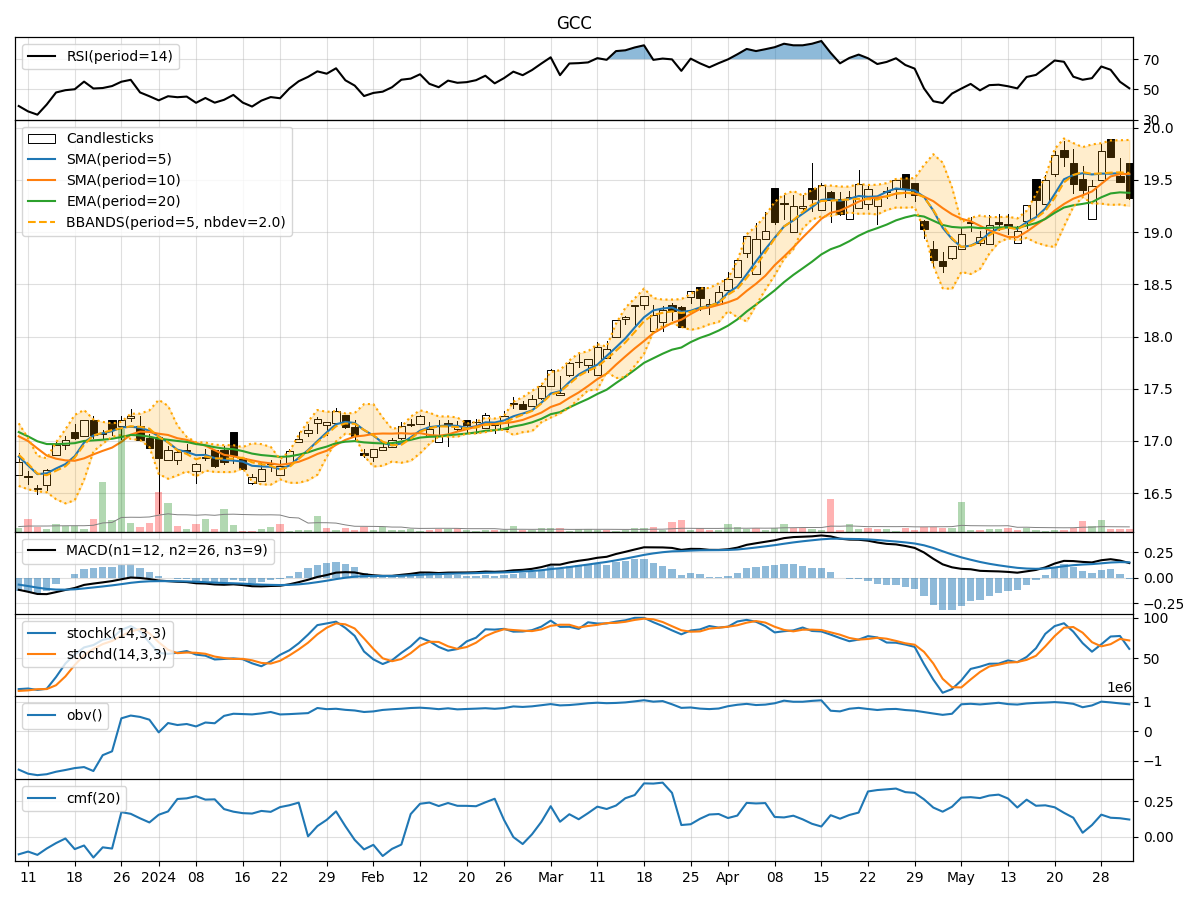
- Moving Averages (MA): The 5-day Moving Average (MA) has been relatively stable around 19.55, indicating a consistent trend in the stock price.
- MACD: The Moving Average Convergence Divergence (MACD) has shown a slight increase over the past few days, suggesting a potential bullish momentum.
- RSI: The Relative Strength Index (RSI) has been fluctuating but remains above 50, indicating a neutral to slightly bullish sentiment.
Key Observation: The trend indicators suggest a potential bullish bias in the stock price movement.
Momentum Analysis:
- Stochastic Oscillator: The Stochastic Oscillator has shown fluctuations but is currently in the oversold territory, indicating a possible reversal in the stock price.
- Williams %R: The Williams %R is in the oversold region, signaling a potential buying opportunity.
Key Observation: Momentum indicators point towards a potential reversal or upward movement in the stock price.
Volatility Analysis:
- Bollinger Bands: The Bollinger Bands have shown narrowing bands, indicating decreasing volatility in the stock price.
- Bollinger %B: The %B indicator is below 1, suggesting the stock price is trading below the lower band.
Key Observation: Volatility indicators signal a period of consolidation or a potential breakout in the stock price.
Volume Analysis:
- On-Balance Volume (OBV): The OBV has shown mixed movements but has not diverged significantly from the price trend.
- Chaikin Money Flow (CMF): The CMF remains positive, indicating buying pressure in the stock.
Key Observation: Volume indicators suggest a neutral stance in the stock price movement.
Conclusion:
Based on the analysis of trend, momentum, volatility, and volume indicators, the overall outlook for GCC stock in the next few days is bullish with a potential upward movement. The trend indicators point towards a bullish bias, while momentum indicators indicate a possible reversal to the upside. Volatility signals a period of consolidation before a potential breakout, and volume indicators suggest a neutral stance with slight buying pressure.
In conclusion, the next few days may see an upward movement in GCC stock price, with potential bullish momentum and a breakout from the current consolidation phase. Traders and investors could consider taking long positions or monitoring the stock closely for buying opportunities.