Technical Analysis of GUNR 2024-05-31
Overview:
In analyzing the technical indicators for GUNR over the last 5 days, we will delve into the trend, momentum, volatility, and volume indicators to provide a comprehensive outlook on the possible stock price movement. By examining these key factors, we aim to offer valuable insights and predictions for the upcoming days.
Trend Analysis:
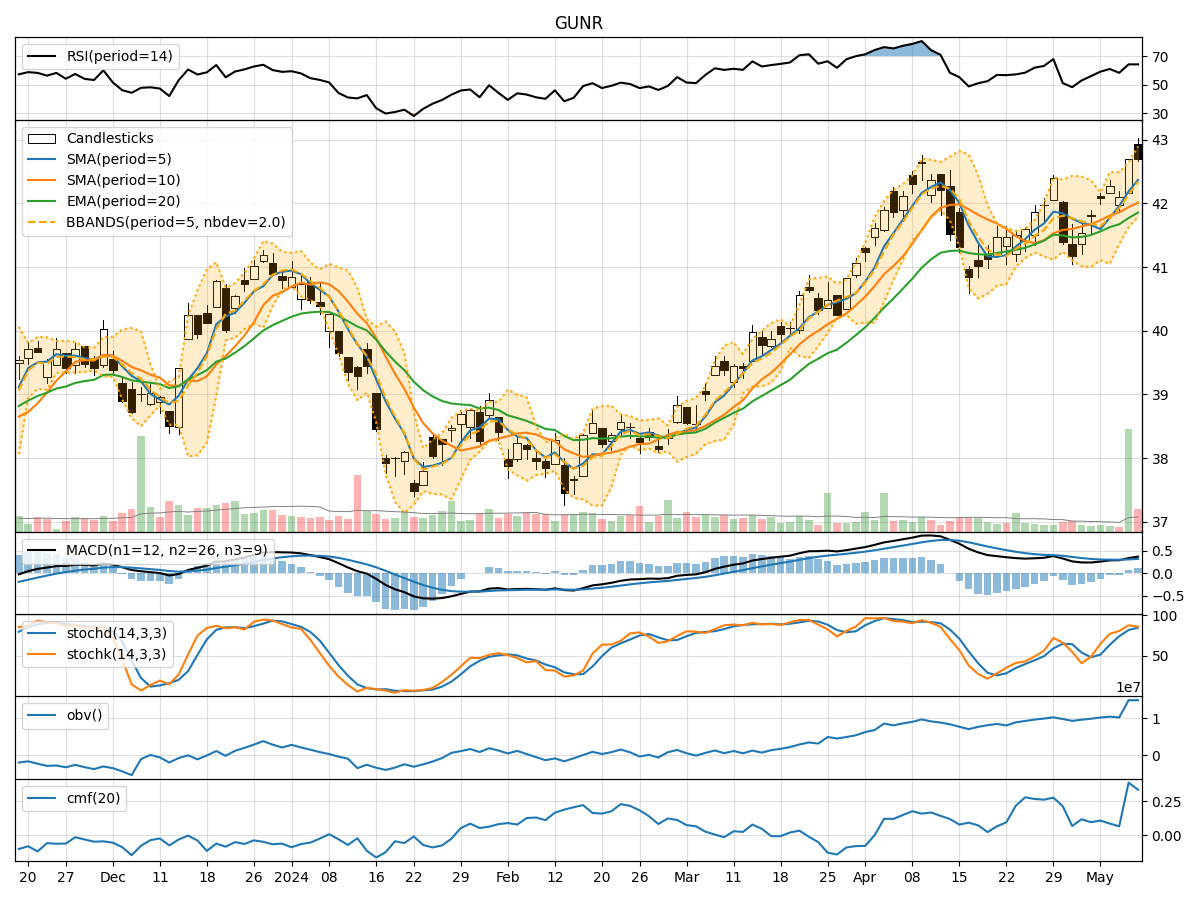
- Moving Averages (MA): The 5-day Moving Average (MA) has been fluctuating around the closing prices, indicating a short-term trend. The Simple Moving Average (SMA) and Exponential Moving Average (EMA) show a slight convergence but remain close to the current price levels.
- MACD: The Moving Average Convergence Divergence (MACD) and its signal line have been hovering around the zero line, suggesting a lack of strong trend direction.
- Conclusion: The trend indicators suggest a sideways movement with a lack of clear trend direction.
Momentum Analysis:
- RSI: The Relative Strength Index (RSI) has been oscillating around the 50 level, indicating a balanced momentum between buying and selling pressure.
- Stochastic Oscillator: Both %K and %D lines of the Stochastic Oscillator are in the oversold region, signaling a potential reversal in momentum.
- Conclusion: The momentum indicators suggest a neutral stance with a potential for a bullish reversal.
Volatility Analysis:
- Bollinger Bands (BB): The Bollinger Bands have been narrowing, indicating decreasing volatility in the stock price.
- Conclusion: The volatility indicators suggest a consolidation phase with a potential breakout in either direction.
Volume Analysis:
- On-Balance Volume (OBV): The OBV has been relatively stable, indicating a balance between buying and selling pressure.
- Chaikin Money Flow (CMF): The CMF has been positive, suggesting a net inflow of money into the stock.
- Conclusion: The volume indicators suggest a neutral to slightly bullish sentiment in terms of volume flow.
Overall Conclusion:
Considering the analysis of trend, momentum, volatility, and volume indicators, the next few days for GUNR could see a sideways movement with a potential for a bullish reversal in momentum. The narrowing Bollinger Bands and stable volume indicators support the view of a consolidation phase with a possible breakout. Traders should closely monitor the momentum indicators for any signs of a bullish reversal and be prepared for increased volatility.
Key Takeaways:
- Trend: Sideways movement with no clear trend direction.
- Momentum: Neutral stance with potential for a bullish reversal.
- Volatility: Consolidation phase with potential breakout.
- Volume: Neutral to slightly bullish sentiment.
Recommendation:
Based on the analysis, it is advisable to closely monitor the stock for any signs of a bullish momentum reversal. Traders should consider setting appropriate stop-loss levels and be prepared for increased volatility in the coming days. Additionally, keeping an eye on key support and resistance levels can help in making informed trading decisions.
Disclaimer:
This analysis is based on historical data and technical indicators, and actual market movements may vary. It is essential to conduct thorough research and consider other fundamental factors before making any investment decisions. Consulting with a financial advisor is recommended for personalized investment advice tailored to individual risk tolerance and financial goals.