Technical Analysis of IUSG 2024-05-31
Overview:
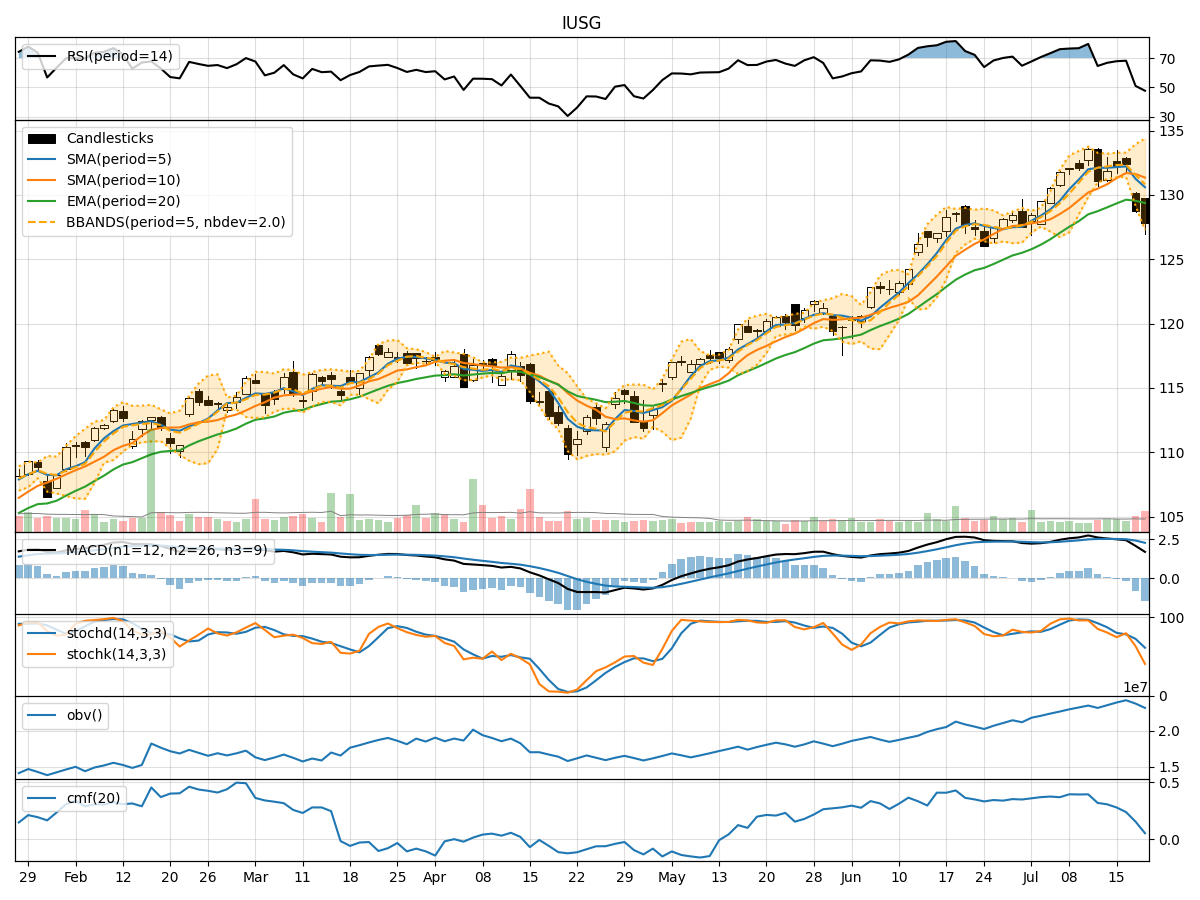
In analyzing the technical indicators for IUSG over the last 5 days, we will delve into the trend, momentum, volatility, and volume indicators to provide a comprehensive outlook on the possible stock price movement in the coming days. By examining these key indicators, we aim to offer valuable insights and predictions to guide your investment decisions.
Trend Indicators:
- Moving Averages (MA): The 5-day moving average has been consistently above the 10-day simple moving average, indicating a short-term bullish trend.
- Exponential Moving Average (EMA): The EMA has been steadily increasing, reflecting positive price momentum.
- Moving Average Convergence Divergence (MACD): The MACD line has been above the signal line, suggesting bullish momentum.
Key Observation: The trend indicators point towards an upward trend in the stock price.
Momentum Indicators:
- Relative Strength Index (RSI): RSI values have been fluctuating but generally staying within the neutral range, indicating balanced momentum.
- Stochastic Oscillator: The stochastic indicators have shown some volatility but are currently in the overbought territory.
- Williams %R (Willams %R): The Williams %R is in the oversold region, suggesting a potential reversal.
Key Observation: Momentum indicators suggest a mixed sentiment with a slight bearish bias.
Volatility Indicators:
- Bollinger Bands (BB): The bands have been widening, indicating increased volatility in the stock price.
- Bollinger Band Percentage (BBP): The BBP values have been fluctuating, reflecting the changing volatility levels.
Key Observation: Volatility indicators signal increased volatility in the stock price.
Volume Indicators:
- On-Balance Volume (OBV): The OBV has shown fluctuations but has not confirmed a clear trend.
- Chaikin Money Flow (CMF): The CMF has been gradually increasing, indicating buying pressure.
Key Observation: Volume indicators suggest mixed trading activity with a slight bullish bias.
Conclusion:
Based on the analysis of the technical indicators, the stock price of IUSG is likely to experience upward movement in the coming days, supported by the positive trend indicators. However, the mixed sentiment from momentum indicators and increased volatility levels from volatility indicators may introduce some short-term fluctuations in the price. Overall, considering the bullish trend and positive volume indicators, investors may expect the stock price to continue its upward trajectory in the near future.