Technical Analysis of IWY 2024-05-31
Overview:
In analyzing the technical indicators for IWY over the last 5 days, we will delve into the trend, momentum, volatility, and volume indicators to provide a comprehensive outlook on the possible stock price movement in the coming days.
Trend Analysis:
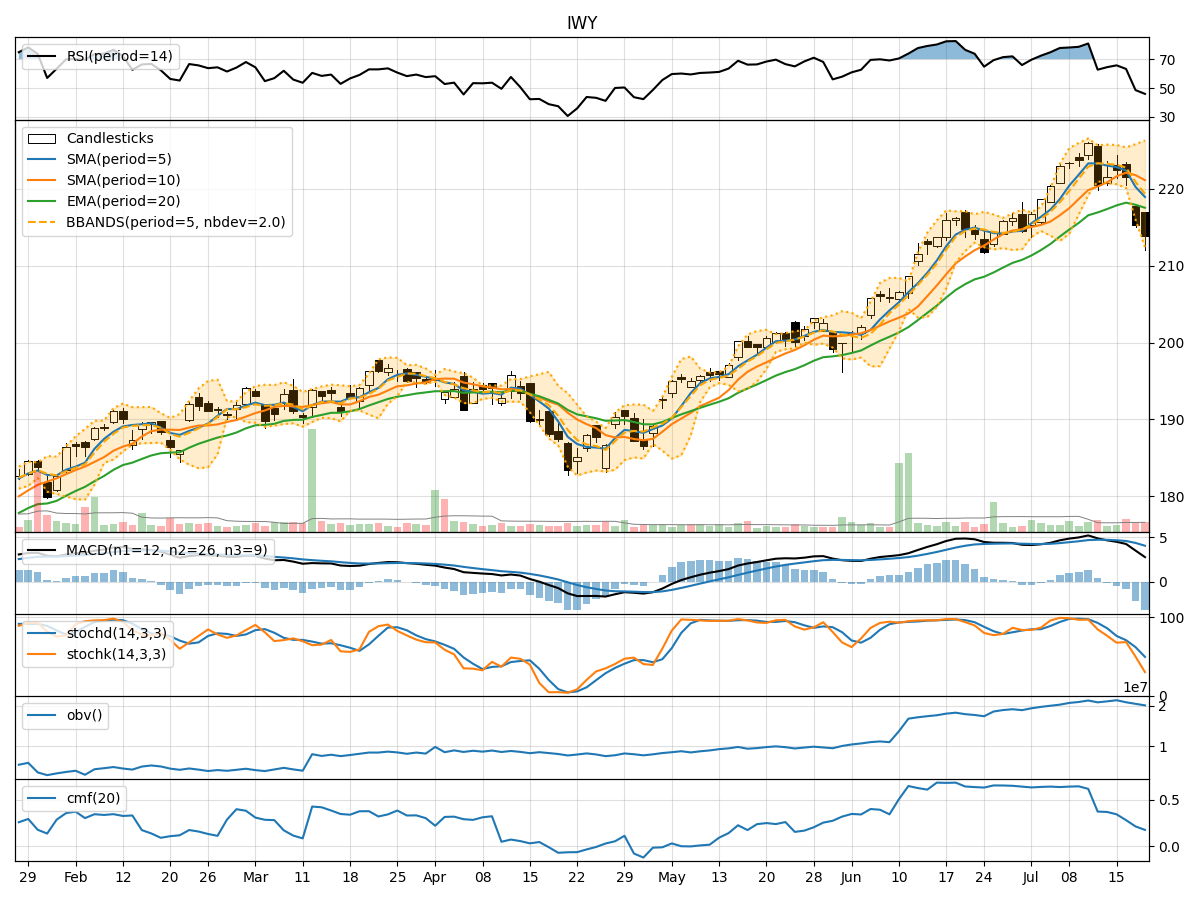
- Moving Averages (MA): The 5-day Moving Average (MA) has been fluctuating around the current price, indicating a short-term trend. The Simple Moving Average (SMA) and Exponential Moving Average (EMA) show a gradual increase over the period.
- MACD: The Moving Average Convergence Divergence (MACD) and its signal line have been relatively stable, with the MACD line slightly above the signal line, suggesting a potential bullish momentum.
Momentum Analysis:
- RSI: The Relative Strength Index (RSI) has been oscillating in the neutral zone, indicating a balanced momentum without extreme overbought or oversold conditions.
- Stochastic Oscillator: Both %K and %D lines of the Stochastic Oscillator have shown fluctuations, with %K dipping below %D recently, signaling a potential reversal in momentum.
Volatility Analysis:
- Bollinger Bands (BB): The Bollinger Bands have widened, indicating increased volatility in the stock price. The current price is hovering around the upper band, suggesting a potential overbought condition.
- Bollinger %B: The %B indicator is relatively low, indicating a possible pullback or consolidation phase in the near term.
Volume Analysis:
- On-Balance Volume (OBV): The OBV has shown a slight increase, suggesting a positive accumulation of volume over the period.
- Chaikin Money Flow (CMF): The CMF has been on an upward trend, indicating buying pressure in the stock.
Conclusion:
Based on the analysis of the technical indicators: - Trend: The moving averages and MACD signal a bullish trend in the short term. - Momentum: The RSI and Stochastic Oscillator suggest a neutral momentum with a potential reversal. - Volatility: The widening Bollinger Bands and low %B point towards a possible consolidation or pullback. - Volume: The OBV and CMF indicate positive accumulation and buying pressure.
Overall View:
Considering the technical indicators collectively, the stock price of IWY is likely to experience consolidation or a minor pullback in the coming days after the recent bullish trend. Traders may consider waiting for a clearer signal before entering new positions.