Technical Analysis of IYE 2024-05-31
Overview:
In analyzing the technical indicators for IYE over the last 5 days, we will delve into the trends, momentum, volatility, and volume indicators to provide insights into the possible future stock price movements. By examining these key aspects, we aim to offer a comprehensive analysis and make informed predictions for the upcoming trading days.
Trend Analysis:
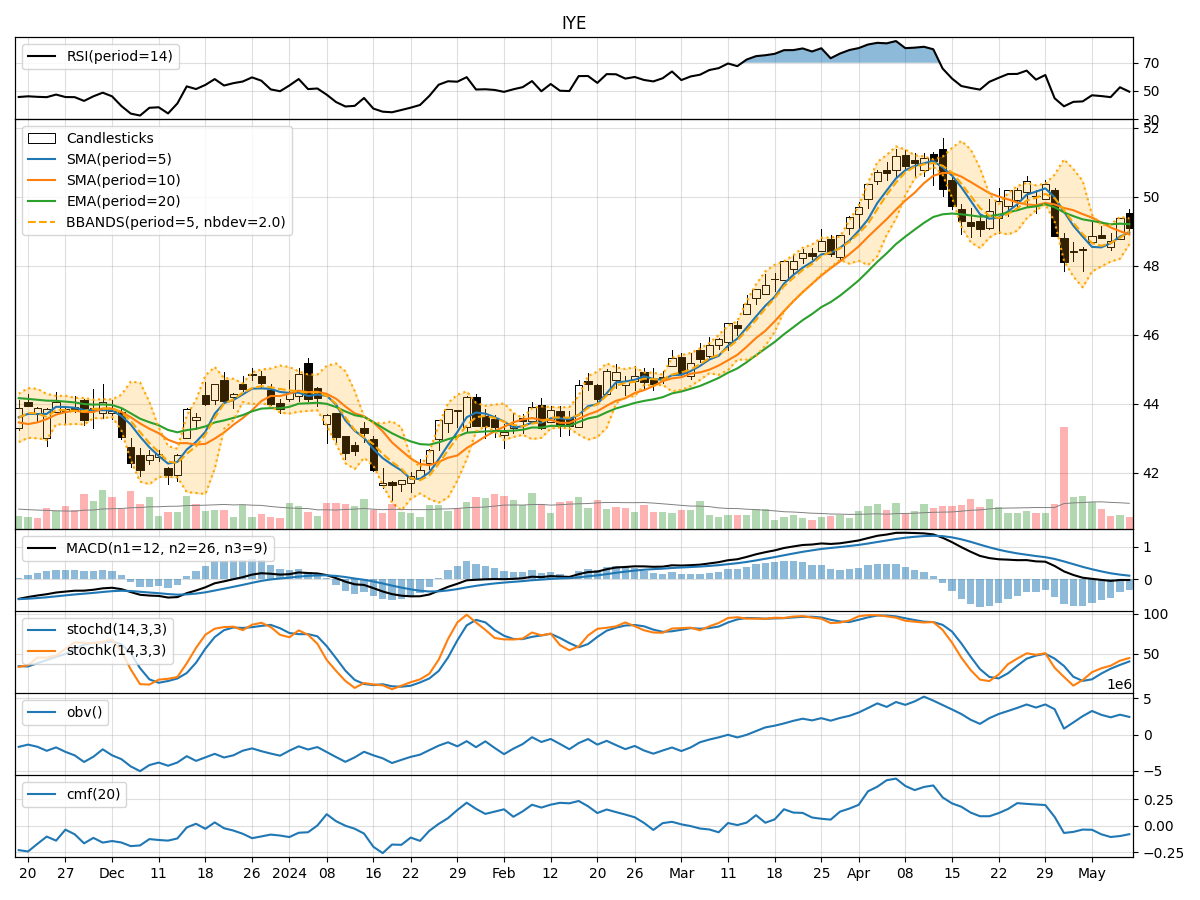
- Moving Averages (MA): The 5-day Moving Average (MA) has been fluctuating around the closing prices, indicating a lack of clear trend direction.
- MACD: The Moving Average Convergence Divergence (MACD) has been consistently negative, suggesting a bearish momentum in the short term.
- EMA: The Exponential Moving Average (EMA) has been declining, further supporting the bearish sentiment in the market.
Momentum Analysis:
- RSI: The Relative Strength Index (RSI) has been hovering around the oversold territory, indicating a potential reversal or consolidation phase.
- Stochastic Oscillator: Both %K and %D have been relatively low, signaling a potential oversold condition in the market.
- Williams %R: The Williams %R is in the oversold region, suggesting a possible buying opportunity in the near future.
Volatility Analysis:
- Bollinger Bands: The Bollinger Bands have been narrowing, indicating decreasing volatility in the stock price.
- Bollinger %B: The %B indicator has been fluctuating within a tight range, reflecting a period of consolidation or indecision in the market.
Volume Analysis:
- On-Balance Volume (OBV): The OBV has shown mixed signals, with no clear trend in volume accumulation or distribution.
- Chaikin Money Flow (CMF): The CMF has been negative, suggesting a lack of buying pressure in the market.
Key Observations:
- The trend indicators point towards a bearish sentiment, with the MACD and EMA showing consistent downward trends.
- Momentum indicators suggest a potential reversal or consolidation phase, as RSI and Williams %R indicate oversold conditions.
- Volatility indicators reflect decreasing price fluctuations, possibly leading to a period of consolidation.
- Volume indicators show mixed signals, with no clear accumulation or distribution pattern.
Conclusion:
Based on the analysis of the technical indicators, the outlook for the next few days leans towards a sideways to slightly bearish movement. The bearish trend indicated by the MACD and EMA, coupled with oversold conditions in the momentum indicators, suggests a potential consolidation phase or a minor downward correction in the stock price. The decreasing volatility and lack of significant volume accumulation further support this view.
Recommendation: It is advisable for investors to exercise caution and closely monitor the price action for any signs of a reversal or confirmation of the bearish trend. Consider setting appropriate stop-loss levels and wait for clearer signals before making significant trading decisions.