Technical Analysis of PRFZ 2024-05-31
Overview:
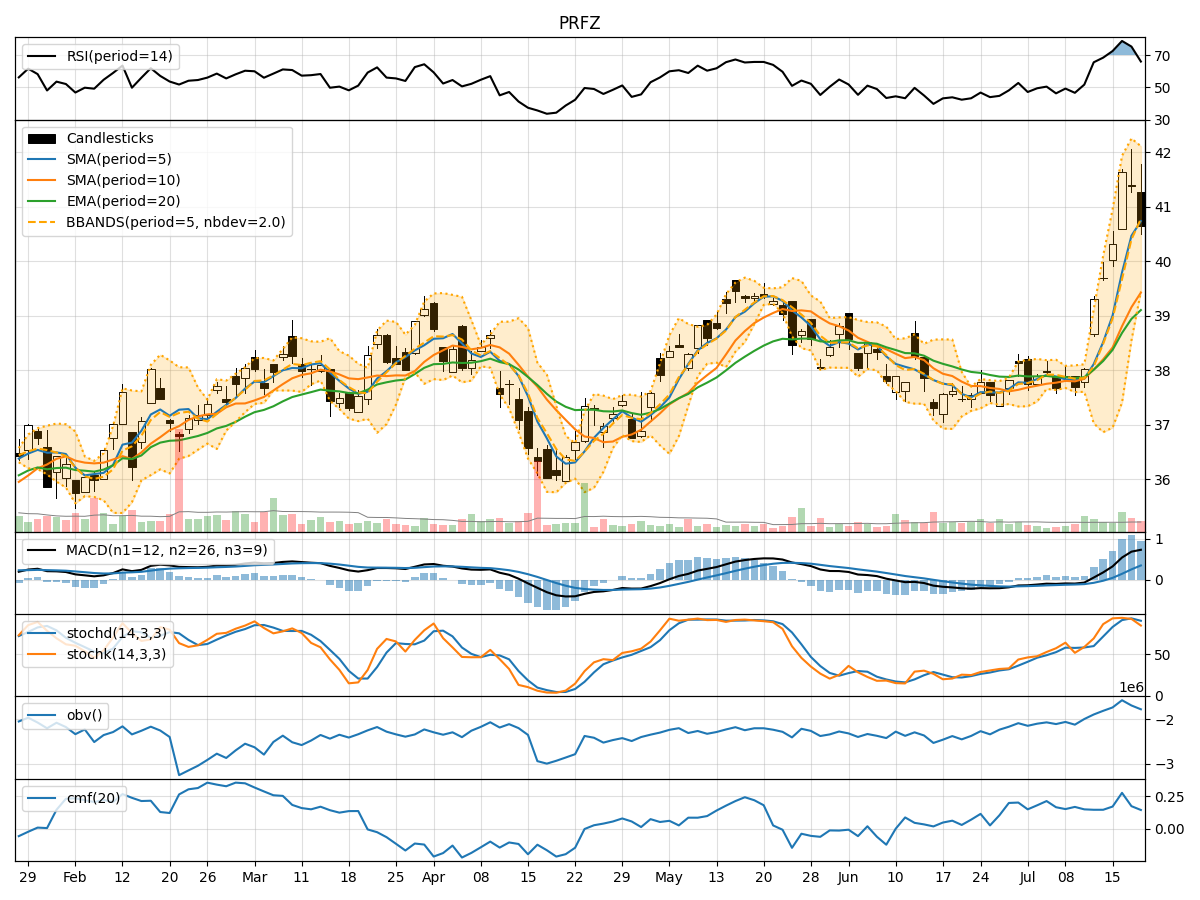
In analyzing the technical indicators for PRFZ over the last 5 days, we will delve into the trend, momentum, volatility, and volume indicators to provide a comprehensive outlook on the possible stock price movement. By examining these key aspects, we aim to offer valuable insights and predictions for the upcoming days.
Trend Analysis:
- Moving Averages (MA): The 5-day MA has been consistently below the closing prices, indicating a short-term downtrend.
- MACD: The MACD line has been positive but decreasing, while the MACD Histogram has been negative, suggesting a weakening bullish momentum.
Momentum Analysis:
- RSI: The RSI has been fluctuating around the 50 level, indicating indecision in the market.
- Stochastic Oscillator: Both %K and %D have been in oversold territory, signaling a potential reversal.
Volatility Analysis:
- Bollinger Bands (BB): The stock price has been trading within the bands, with the lower band acting as support.
Volume Analysis:
- On-Balance Volume (OBV): The OBV has been declining, indicating selling pressure.
- Chaikin Money Flow (CMF): The CMF has been negative, suggesting outflows from the stock.
Key Observations:
- The stock is currently in a short-term downtrend based on moving averages.
- Momentum indicators show mixed signals with RSI around neutral levels and stochastic indicators in oversold territory.
- Volatility has been relatively stable within the Bollinger Bands.
- Volume indicators reflect a decrease in buying interest as OBV and CMF are negative.
Conclusion:
Based on the analysis of the technical indicators, the stock price of PRFZ is likely to experience further downside movement in the next few days. The trend indicators suggest a continuation of the short-term downtrend, supported by weakening momentum and negative volume indicators. Traders should exercise caution and consider shorting or staying on the sidelines until a clearer bullish signal emerges.