Technical Analysis of PSCI 2024-05-31
Overview:
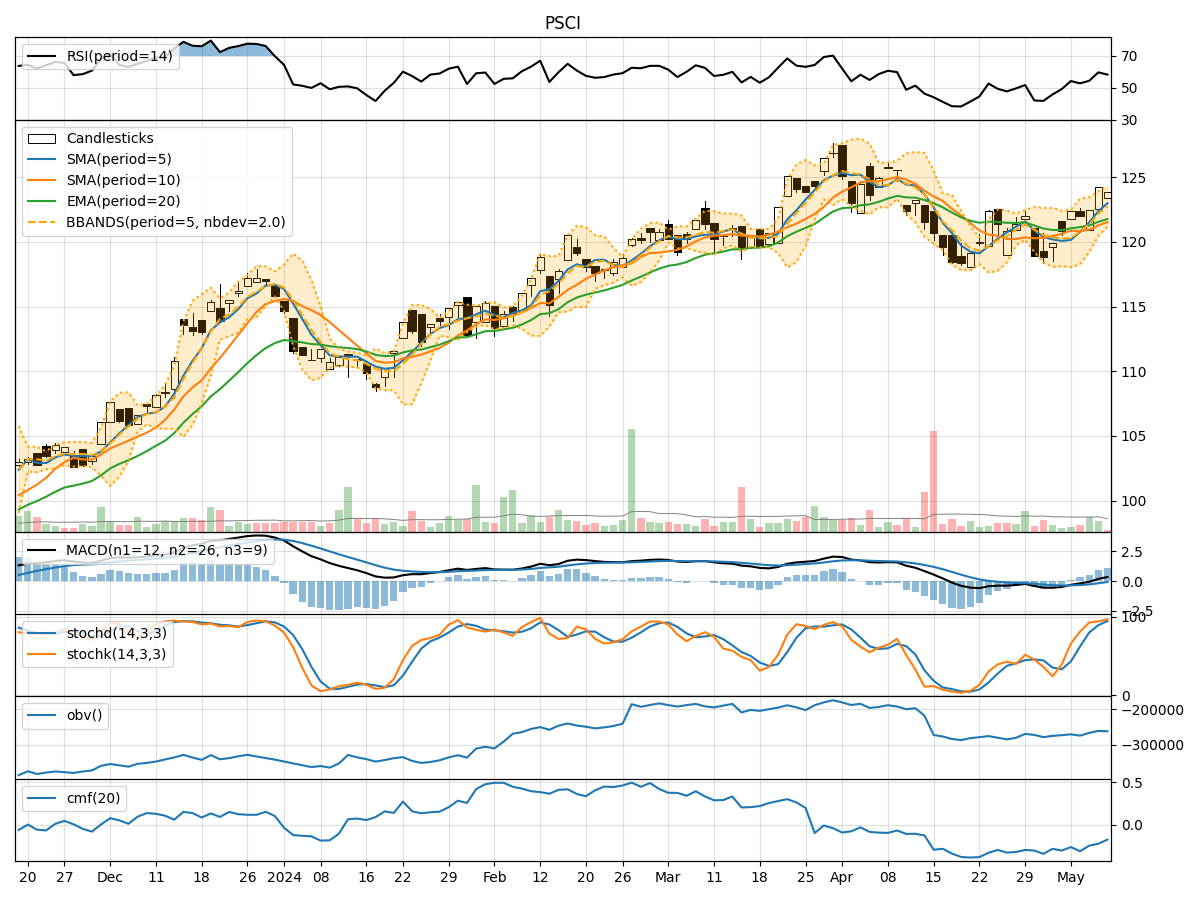
In analyzing the technical indicators for PSCI stock over the last 5 days, we will delve into the trend, momentum, volatility, and volume indicators to provide a comprehensive outlook on the possible stock price movement in the coming days.
Trend Analysis:
- Moving Averages (MA): The 5-day Moving Average (MA) has been fluctuating around the closing prices, indicating short-term price trends. The Simple Moving Average (SMA) and Exponential Moving Average (EMA) have shown slight variations but have not diverged significantly.
- MACD: The Moving Average Convergence Divergence (MACD) has been positive but decreasing, suggesting a potential slowdown in the bullish momentum.
- MACD Histogram: The MACD Histogram has been declining, indicating a decrease in the bullish momentum.
Momentum Analysis:
- RSI: The Relative Strength Index (RSI) has been fluctuating around the mid-level, indicating a lack of strong overbought or oversold conditions.
- Stochastic Oscillator: Both %K and %D of the Stochastic Oscillator have been fluctuating, showing indecision in the momentum.
- Williams %R: The Williams %R has been hovering around the oversold territory, suggesting a potential reversal in the short term.
Volatility Analysis:
- Bollinger Bands (BB): The Bollinger Bands have been narrowing, indicating decreasing volatility in the stock price.
- Bollinger %B: The %B indicator has been fluctuating within a narrow range, suggesting a lack of significant price extremes.
Volume Analysis:
- On-Balance Volume (OBV): The OBV has been negative, indicating a net selling pressure in the stock.
- Chaikin Money Flow (CMF): The CMF has been negative, suggesting a lack of buying interest in the stock.
Key Observations:
- The trend indicators show a potential slowdown in the bullish momentum.
- Momentum indicators reflect indecision and a possible reversal in the short term.
- Volatility indicators point towards decreasing volatility.
- Volume indicators indicate a net selling pressure and lack of buying interest.
Conclusion:
Based on the analysis of the technical indicators, the stock price of PSCI is likely to experience further downward movement in the coming days. The trend indicators suggest a potential slowdown in the bullish momentum, while momentum indicators indicate indecision and a possible reversal. Additionally, volatility is decreasing, and volume indicators show selling pressure and lack of buying interest. Therefore, it is advisable to exercise caution and consider potential short-term bearish positions or wait for more clarity in the market before making any investment decisions.