Technical Analysis of PSCT 2024-05-31
Overview:
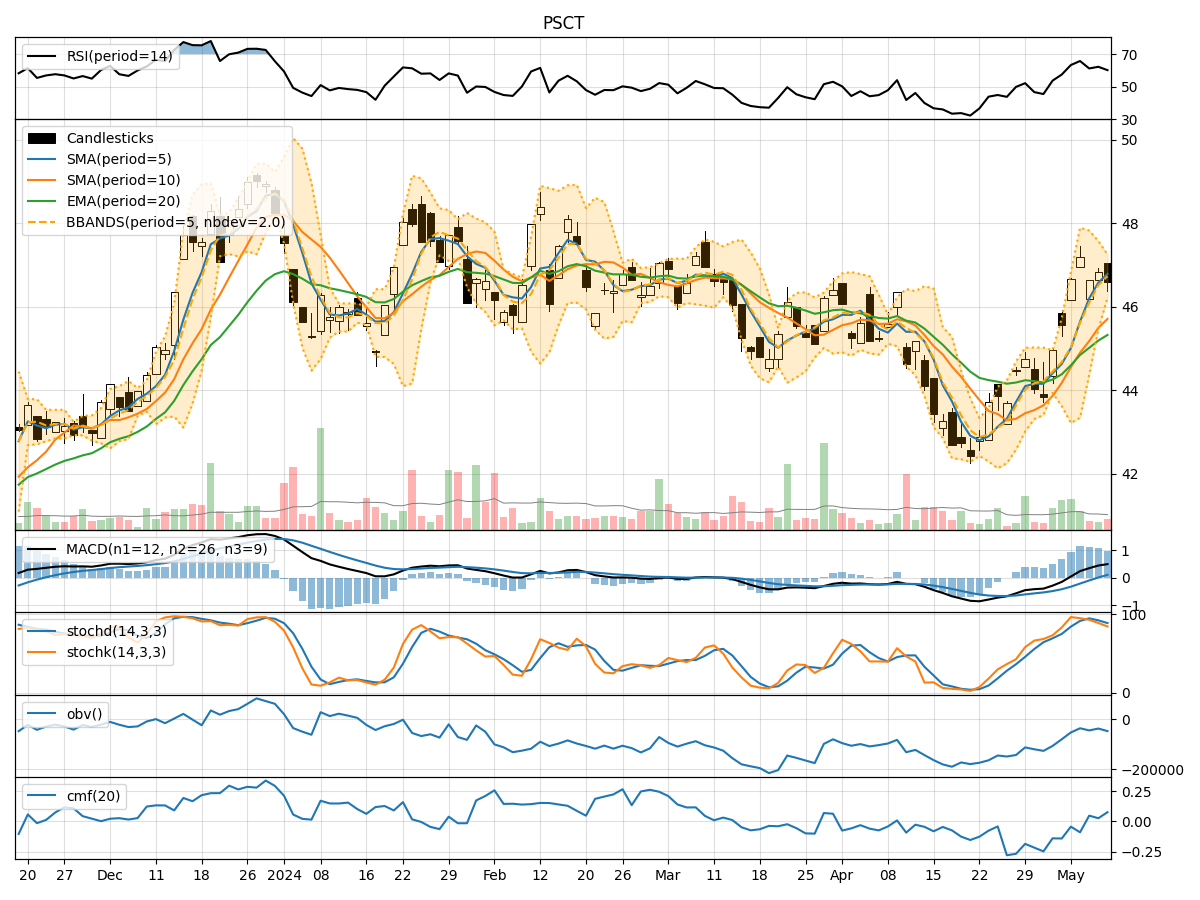
In analyzing the technical indicators for PSCT over the last 5 days, we will delve into the trend, momentum, volatility, and volume indicators to provide a comprehensive assessment of the stock's potential price movement. By examining these key factors, we aim to offer valuable insights and predictions for the next few days.
Trend Analysis:
- Moving Averages (MA): The 5-day MA has been gradually decreasing, indicating a short-term bearish trend.
- MACD: The MACD line has been declining, with the MACD histogram also showing a decrease in bullish momentum.
- EMA: The EMA has been relatively stable but slightly decreasing, suggesting a potential consolidation phase.
Momentum Analysis:
- RSI: The RSI has been fluctuating around the neutral zone, indicating indecision in the market.
- Stochastic Oscillator: Both %K and %D have been decreasing, signaling a potential bearish momentum.
- Williams %R: The Williams %R is in oversold territory, suggesting a possible reversal or consolidation.
Volatility Analysis:
- Bollinger Bands (BB): The stock price has been trading within the bands, indicating a period of consolidation.
- BB Width: The BB width has been relatively stable, suggesting a lack of significant price volatility.
Volume Analysis:
- On-Balance Volume (OBV): The OBV has been fluctuating, indicating mixed buying and selling pressure.
- Chaikin Money Flow (CMF): The CMF has been relatively stable but trending slightly downwards, reflecting a potential decrease in buying pressure.
Key Observations:
- The trend indicators suggest a short-term bearish bias, supported by the declining moving averages and MACD.
- Momentum indicators show mixed signals, with the RSI hovering around neutrality and stochastic indicators pointing towards a bearish momentum.
- Volatility remains relatively low, as indicated by the stable Bollinger Bands width.
- Volume indicators reflect a lack of strong buying or selling pressure, with OBV and CMF showing mixed signals.
Conclusion:
Based on the analysis of the technical indicators, the stock price of PSCT is likely to experience a further downward movement in the next few days. The bearish trend indicated by the moving averages and MACD, coupled with the bearish momentum suggested by the stochastic indicators, points towards a potential continuation of the current downtrend. Additionally, the lack of significant volatility and mixed volume signals further support the view of a downward price movement. Traders and investors should exercise caution and consider short-term selling strategies in anticipation of a bearish trend in the coming days.