Technical Analysis of QQXT 2024-05-31
Overview:
In analyzing the provided QQXT TA data for the last 5 days, we will delve into the technical indicators across trend, momentum, volatility, and volume to forecast the possible stock price movement in the upcoming days. By examining key metrics such as moving averages, MACD, RSI, Bollinger Bands, and OBV, we aim to provide a comprehensive and insightful prediction for the stock's future direction.
Trend Analysis:
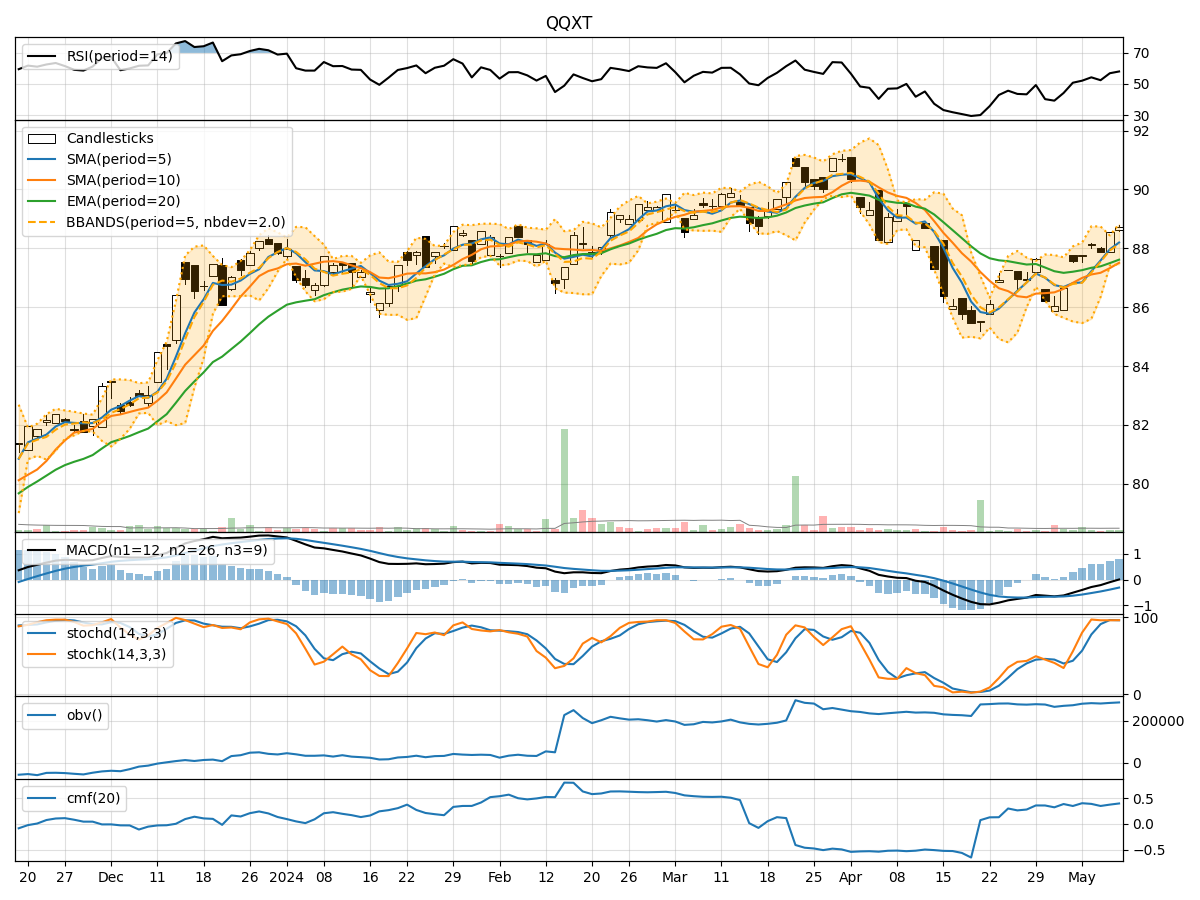
- Moving Averages (MA): The 5-day MA has been gradually decreasing, indicating a short-term bearish trend.
- MACD: The MACD line has been positive but decreasing, while the MACD Histogram has been consistently negative, suggesting a weakening bullish momentum.
- EMA: The EMA has been declining, aligning with the bearish sentiment in the short term.
Momentum Analysis:
- RSI: The RSI has been fluctuating around the neutral zone, indicating indecision in the market.
- Stochastic Oscillator: Both %K and %D have been trending downwards, signaling a potential bearish momentum.
- Williams %R: The indicator has been in oversold territory, suggesting a possible reversal or continuation of the downtrend.
Volatility Analysis:
- Bollinger Bands (BB): The stock price has been trading within the bands, with the lower band acting as a support level.
- BB Width: The bands have been narrowing, indicating decreasing volatility in the market.
Volume Analysis:
- On-Balance Volume (OBV): The OBV has shown a slight increase, suggesting some accumulation by investors.
- Chaikin Money Flow (CMF): The CMF has been positive, indicating buying pressure in the market.
Key Observations:
- The stock is currently in a short-term bearish trend based on moving averages and MACD.
- Momentum indicators suggest a lack of strong directional bias, with a potential bearish bias in the near term.
- Volatility has been decreasing, indicating a possible period of consolidation.
- Volume indicators show some accumulation and buying pressure.
Conclusion:
Based on the analysis of the technical indicators, the stock is likely to experience further downward movement in the next few days. The bearish trend indicated by moving averages and MACD, coupled with the bearish momentum suggested by stochastic indicators, supports this view. Additionally, the lack of strong bullish signals from momentum indicators and the narrowing Bollinger Bands point towards a continuation of the current downtrend or a period of consolidation. Investors should exercise caution and consider potential short-term selling opportunities or wait for clearer bullish signals before considering long positions.