Technical Analysis of SOXL 2024-05-31
Overview:
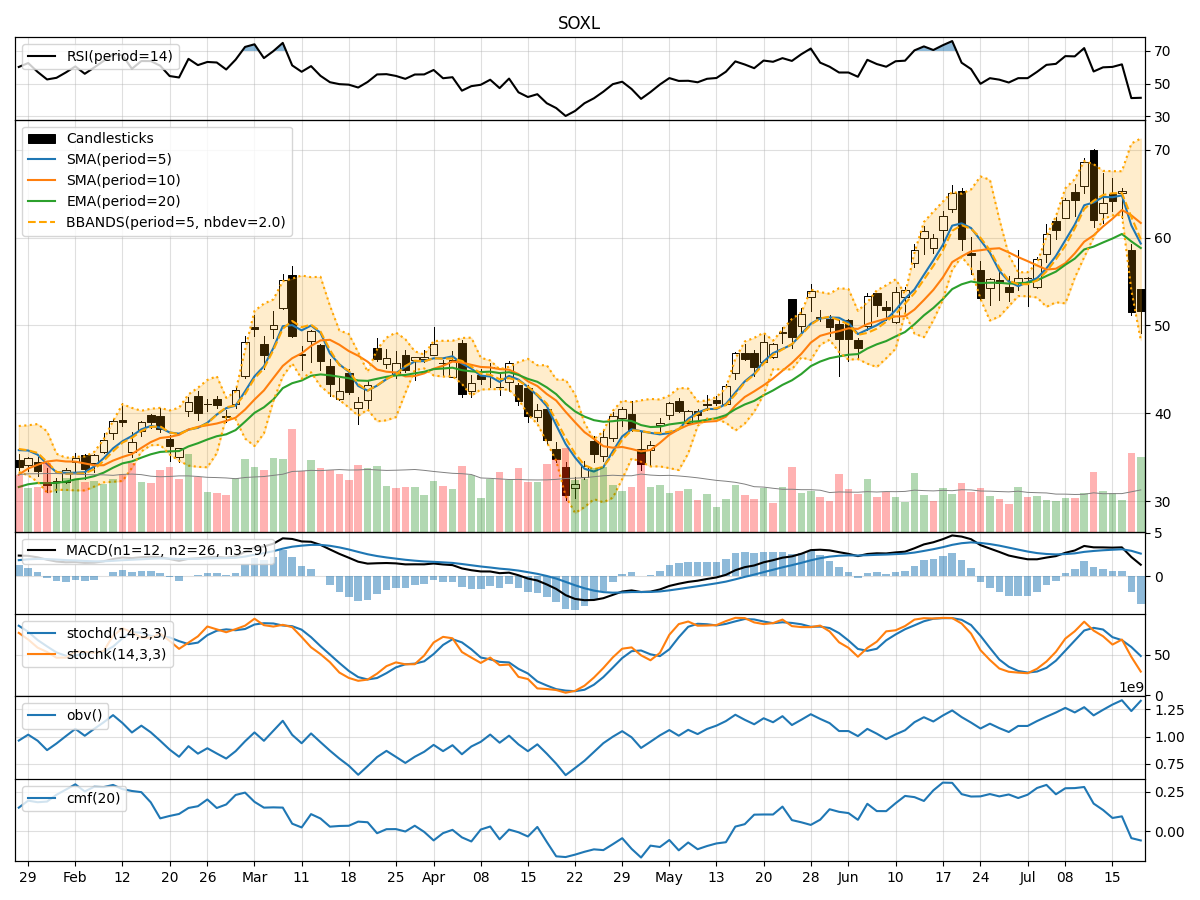
In analyzing the technical indicators for SOXL over the last 5 days, we will delve into the trend, momentum, volatility, and volume indicators to provide a comprehensive outlook on the possible stock price movement in the coming days.
Trend Analysis:
- Moving Averages (MA): The 5-day Moving Average has been consistently above the longer-term Simple Moving Average (SMA) and Exponential Moving Average (EMA), indicating a bullish trend.
- MACD: The MACD line has been above the signal line, with both lines showing an upward trend, suggesting bullish momentum.
Momentum Analysis:
- RSI: The Relative Strength Index (RSI) has been fluctuating but generally staying above 50, indicating a neutral to slightly bullish momentum.
- Stochastic Oscillator: The Stochastic Oscillator has been in the overbought territory, suggesting a potential reversal or consolidation.
Volatility Analysis:
- Bollinger Bands (BB): The stock price has been trading within the Bollinger Bands, with the bands narrowing, indicating decreasing volatility.
Volume Analysis:
- On-Balance Volume (OBV): The OBV has shown mixed signals, with some days seeing an increase in volume and others a decrease.
- Chaikin Money Flow (CMF): The CMF has been positive, indicating buying pressure in the market.
Key Observations:
- The trend indicators suggest a strong bullish sentiment in the short term.
- Momentum indicators show a mixed picture with a slight bullish bias.
- Volatility has been decreasing, indicating a possible period of consolidation.
- Volume indicators are inconclusive, with no clear trend in volume accumulation.
Conclusion:
Based on the analysis of the technical indicators, the next few days for SOXL could see further upward movement in the stock price. The bullish trend indicated by moving averages and MACD, coupled with a neutral to slightly bullish momentum from RSI, suggests potential for price appreciation. However, caution is advised as the Stochastic Oscillator signals potential overbought conditions and the narrowing Bollinger Bands indicate decreasing volatility, possibly leading to a period of consolidation. Overall, the outlook remains bullish with a possibility of consolidation in the near term.