Technical Analysis of SPSB 2024-05-31
Overview:
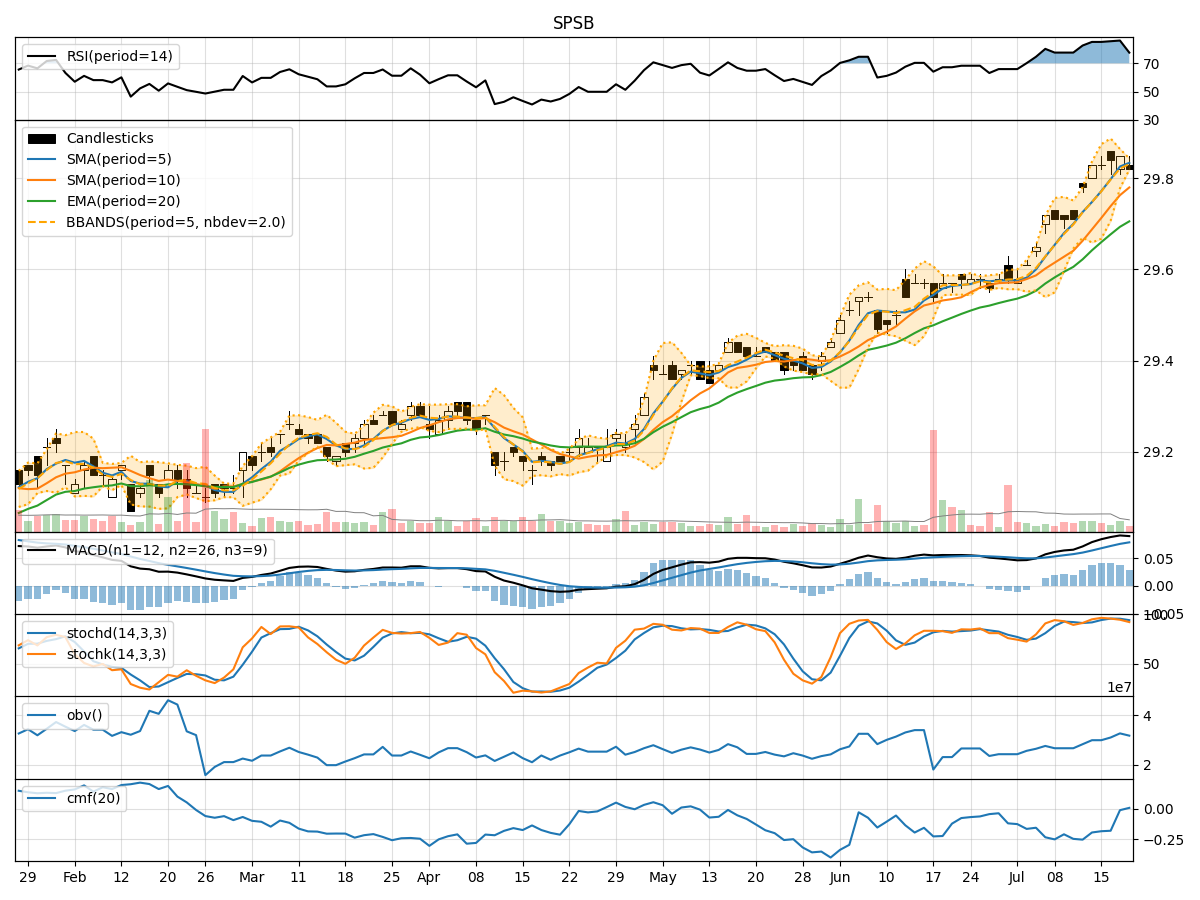
In analyzing the technical indicators for SPSB over the last 5 days, we will delve into the trend, momentum, volatility, and volume indicators to provide a comprehensive outlook on the possible stock price movement. By examining these key aspects, we aim to offer valuable insights and predictions for the upcoming days.
Trend Indicators:
- Moving Averages (MA): The 5-day MA has been relatively stable around the current price, indicating a short-term equilibrium.
- MACD: The MACD line has been positive, suggesting a bullish momentum in the stock.
- EMA: The EMA has shown a slight upward trend, indicating a positive sentiment in the market.
Momentum Indicators:
- RSI: The RSI has been fluctuating around the neutral zone, indicating a balanced momentum.
- Stochastic Oscillator: The stochastic indicators have shown mixed signals, with some days indicating oversold conditions and others showing potential for a bullish reversal.
Volatility Indicators:
- Bollinger Bands (BB): The Bollinger Bands have widened, indicating increased volatility in the stock price.
- BB Percentage (BBP): The BBP has fluctuated, suggesting potential price swings in the near future.
Volume Indicators:
- On-Balance Volume (OBV): The OBV has shown a slight decline, indicating some selling pressure in the stock.
- Chaikin Money Flow (CMF): The CMF has been negative, signaling a bearish sentiment in the market.
Key Observations and Opinions:
- Trend: The trend indicators suggest a slightly bullish sentiment in the stock, supported by the positive MACD and EMA trends.
- Momentum: The momentum indicators are mixed, with RSI hovering around neutrality and stochastic oscillators showing potential for both bullish and bearish movements.
- Volatility: The widening Bollinger Bands indicate increased volatility, which could lead to significant price movements in the coming days.
- Volume: The declining OBV and negative CMF suggest a bearish pressure on the stock, indicating a possible downward trend.
Conclusion:
Based on the analysis of the technical indicators, the stock price of SPSB is likely to experience further downward movement in the next few days. The combination of negative volume indicators, mixed momentum signals, and increased volatility points towards a bearish outlook. Traders and investors should exercise caution and consider potential short-selling opportunities or wait for a clearer trend confirmation before entering any long positions.