Technical Analysis of SUSA 2024-05-31
Overview:
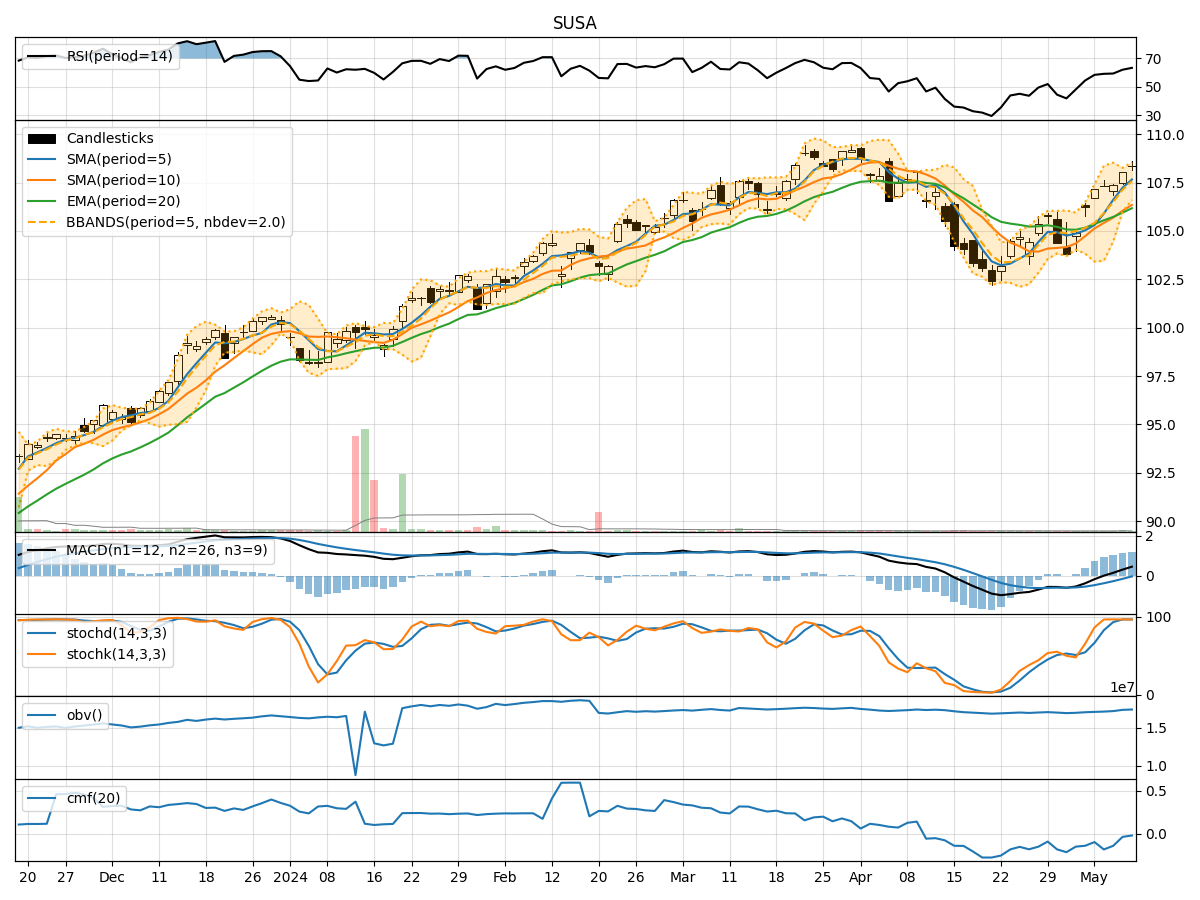
In the last 5 trading days, SUSA stock has shown a slight decline in price from 110.03 to 109.25. Various technical indicators across trend, momentum, volatility, and volume have been analyzed to provide insights into the possible future price movement of the stock.
Trend Analysis:
- Moving averages (MA) indicate a slight downward trend, with the 5-day MA below the 10-day simple moving average (SMA).
- Exponential moving average (EMA) shows a gradual increase but remains below the current price.
- MACD and MACD Histogram are both negative, suggesting a bearish momentum in the short term.
Momentum Analysis:
- Relative Strength Index (RSI) has been decreasing, indicating weakening momentum.
- Stochastic Oscillator shows a downward trend, with both %K and %D decreasing.
- Williams %R is in oversold territory, suggesting a potential reversal.
Volatility Analysis:
- Bollinger Bands are narrowing, indicating decreasing volatility.
- Bollinger Band Percentage (BBP) is low, suggesting a potential breakout or reversal in the near future.
Volume Analysis:
- On-Balance Volume (OBV) has been decreasing, indicating selling pressure.
- Chaikin Money Flow (CMF) is positive but has been declining, signaling potential distribution.
Key Observations:
- Trend: The trend is slightly bearish, with moving averages indicating a downward bias.
- Momentum: Momentum is weakening, as indicated by RSI and Stochastic Oscillator.
- Volatility: Volatility is decreasing, potentially leading to a period of consolidation.
- Volume: Selling pressure is evident, as OBV has been declining.
Conclusion:
Based on the analysis of technical indicators, the next few days for SUSA stock are likely to see further downward movement. The trend is bearish, momentum is weakening, and selling pressure is evident in volume indicators. Traders should exercise caution and consider short-term bearish strategies.