Technical Analysis of USOI 2024-05-31
Overview:
In analyzing the technical indicators for USOI over the last 5 days, we will delve into the trend, momentum, volatility, and volume indicators to provide a comprehensive outlook on the possible stock price movement in the coming days. By examining these key indicators, we aim to offer valuable insights and predictions for potential investors.
Trend Indicators:
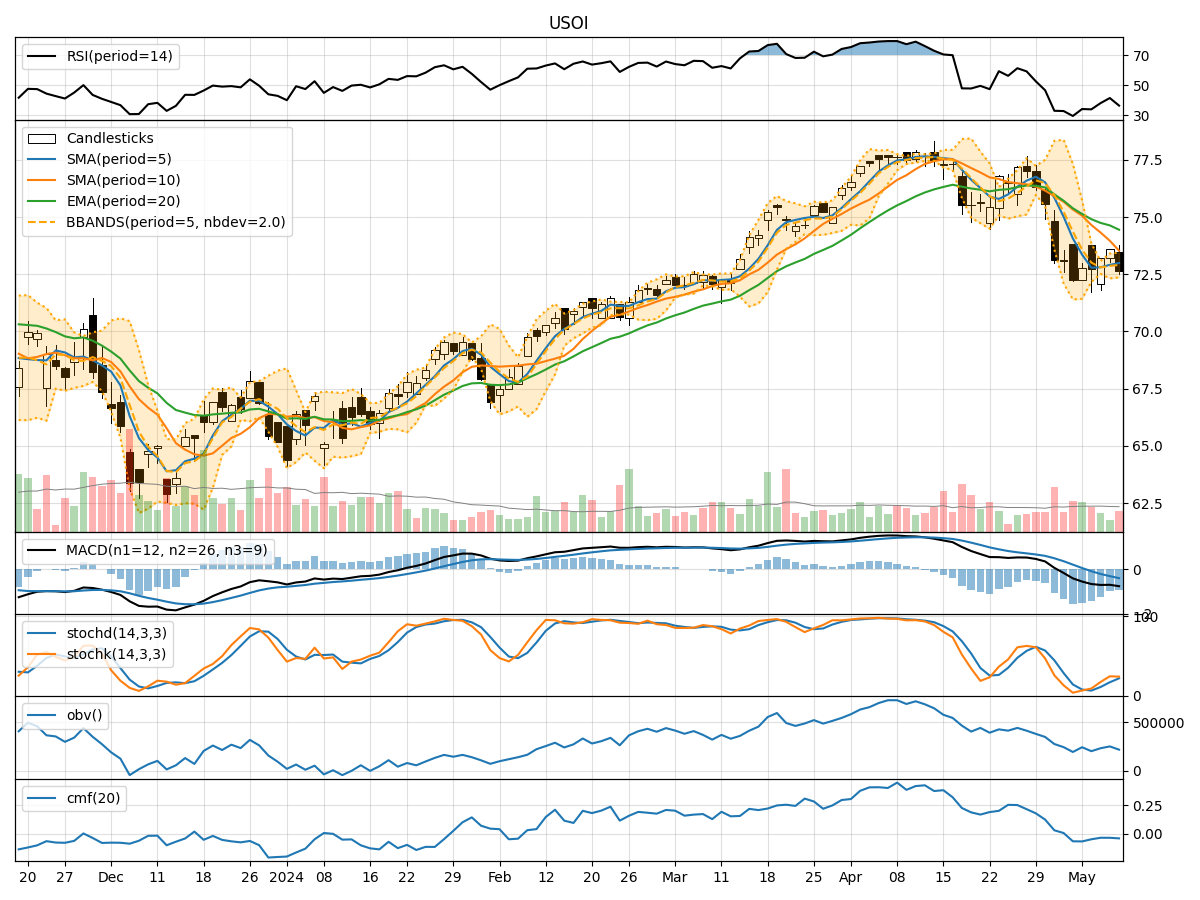
- Moving Averages (MA): The 5-day MA has been fluctuating around the closing prices, indicating short-term price trends. The SMA(10) and EMA(20) have shown a slight downward trend, suggesting a potential bearish sentiment.
- MACD: The MACD line has been consistently below the signal line, indicating a bearish trend in the stock price movement.
- MACD Histogram: The MACD histogram has been negative, further confirming the bearish momentum in the stock.
Momentum Indicators:
- RSI: The RSI has been declining, indicating a weakening momentum in the stock price movement.
- Stochastic Oscillator: Both %K and %D have been trending downwards, suggesting a bearish momentum.
- Williams %R: The Williams %R has been in the oversold territory, indicating a potential reversal or continuation of the bearish trend.
Volatility Indicators:
- Bollinger Bands: The stock price has been trading within the lower Bollinger Band, indicating a potential oversold condition.
- Bollinger %B: The %B indicator has been below 1, suggesting a potential buying opportunity as the stock may be undervalued.
- Bollinger Band Width: The Band Width has been narrowing, indicating a decrease in volatility and a possible consolidation phase.
Volume Indicators:
- On-Balance Volume (OBV): The OBV has been declining, indicating selling pressure in the stock.
- Chaikin Money Flow (CMF): The CMF has been negative, suggesting a bearish sentiment in the stock.
Key Observations and Opinions:
- Trend: The trend indicators point towards a bearish sentiment in the stock price movement.
- Momentum: The momentum indicators also support a bearish outlook, with declining RSI and Stochastic Oscillator.
- Volatility: The narrowing Bollinger Bands and decreasing volatility indicate a potential consolidation phase.
- Volume: The declining OBV and negative CMF suggest selling pressure in the stock.
Conclusion:
Based on the analysis of the technical indicators, the next few days' possible stock price movement for USOI is likely to be downward. The bearish trend, weakening momentum, and selling pressure indicated by the indicators suggest that investors should exercise caution and consider potential short positions or wait for a more favorable entry point. It is essential to monitor the indicators closely for any signs of a trend reversal or shift in market sentiment.