Technical Analysis of VB 2024-05-31
Overview:
In analyzing the technical indicators for VB stock over the last 5 days, we will delve into the trend, momentum, volatility, and volume indicators to provide a comprehensive outlook on the possible stock price movement in the upcoming days. By examining these key indicators, we aim to offer valuable insights and predictions for potential investors and traders.
Trend Analysis:
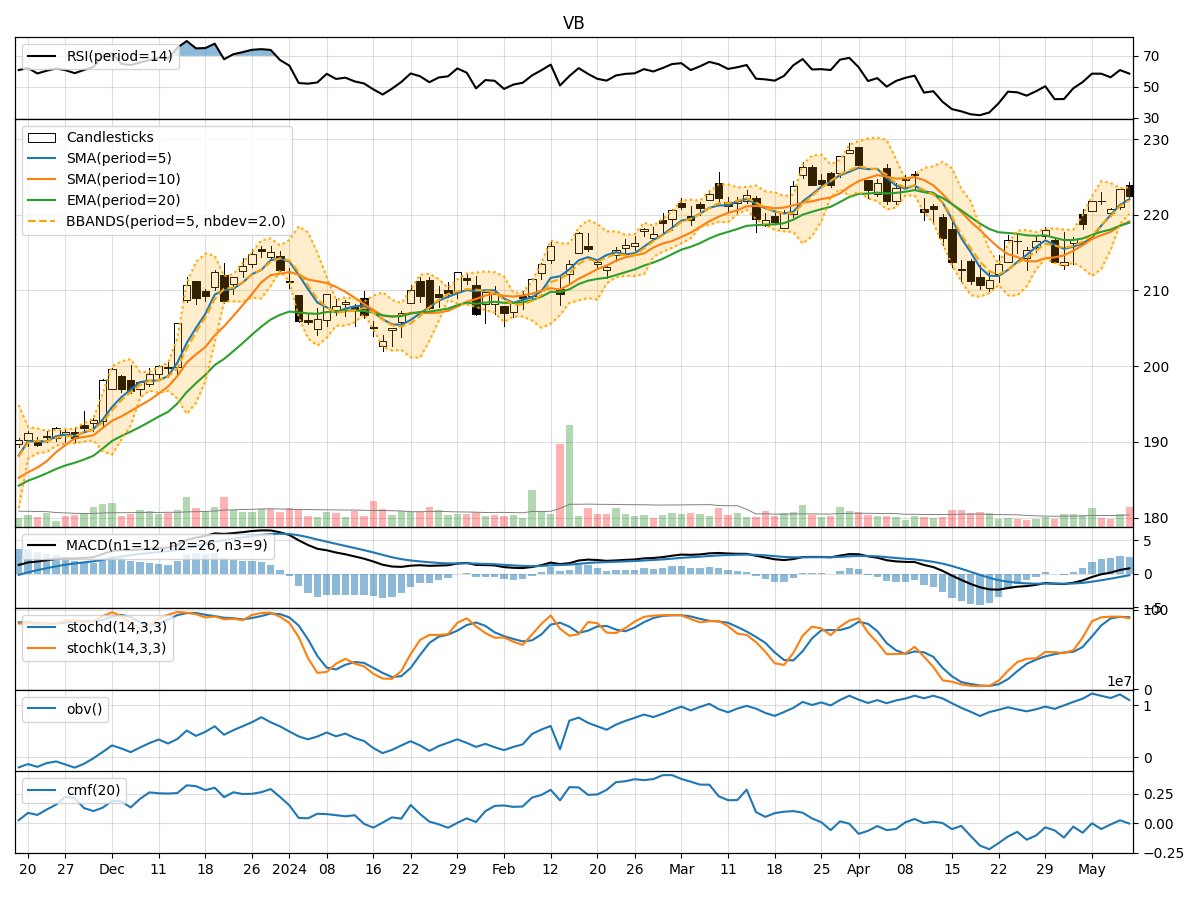
- Moving Averages (MA): The 5-day MA has been consistently below the closing price, indicating a short-term downtrend.
- MACD: The MACD line has been decreasing, with the MACD histogram also showing a downward trend, suggesting a bearish momentum.
- EMA: The EMA has been declining, further supporting the bearish sentiment in the short to medium term.
Momentum Analysis:
- RSI: The RSI has been decreasing, indicating weakening momentum.
- Stochastic Oscillator: Both %K and %D have been trending downwards, signaling a potential oversold condition.
- Williams %R: The indicator has been in the oversold territory, suggesting a possible reversal or consolidation.
Volatility Analysis:
- Bollinger Bands (BB): The stock price has been trading within the lower Bollinger Band, indicating a period of low volatility.
- BB Width: The Bollinger Band width has been narrowing, suggesting a potential breakout or significant price movement ahead.
Volume Analysis:
- On-Balance Volume (OBV): The OBV has been relatively stable, indicating a balance between buying and selling pressure.
- Chaikin Money Flow (CMF): The CMF has shown a slight positive trend, reflecting some accumulation in the stock.
Key Observations:
- The trend indicators, momentum oscillators, and volatility bands all point towards a bearish sentiment in the short term.
- The volume indicators suggest a balanced accumulation and distribution of the stock.
- The narrowing Bollinger Bands indicate a potential breakout, while the oversold conditions in momentum indicators hint at a possible reversal.
Conclusion:
Based on the analysis of the technical indicators, the next few days for VB stock are likely to see a continuation of the bearish trend in the short term. However, the narrowing Bollinger Bands and oversold momentum indicators also suggest a potential reversal or consolidation in the near future. Traders should closely monitor key support and resistance levels for potential entry or exit points, while investors may consider waiting for more clarity in the market direction before making significant decisions.