Technical Analysis of VGIT 2024-05-31
Overview:
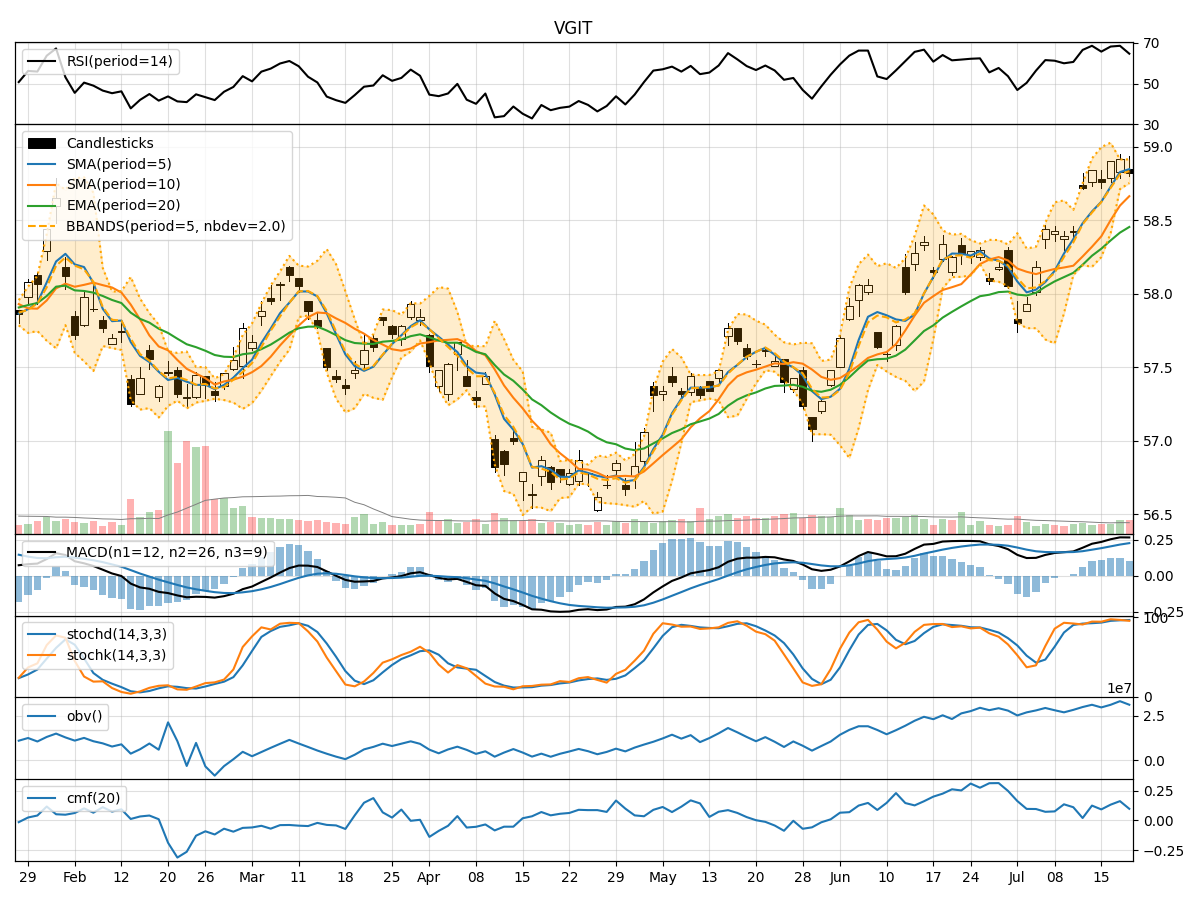
In analyzing the technical indicators for VGIT over the last 5 days, we will delve into the trend, momentum, volatility, and volume indicators to provide a comprehensive outlook on the possible stock price movement in the coming days. By examining these key indicators, we aim to offer valuable insights and predictions for informed decision-making.
Trend Indicators:
- Moving Averages (MA): The 5-day MA has been slightly below the closing prices, indicating a short-term downward trend.
- MACD: The MACD line has been consistently positive, suggesting a bullish momentum.
- MACD Histogram: The histogram has been fluctuating around the zero line, indicating a lack of strong trend direction.
Momentum Indicators:
- RSI: The RSI has been fluctuating around the mid-range, indicating a neutral momentum.
- Stochastic Oscillator: Both %K and %D have been in the oversold region, suggesting a potential reversal.
- Williams %R: The indicator has been in the oversold territory, signaling a possible buying opportunity.
Volatility Indicators:
- Bollinger Bands (BB): The stock price has been trading within the bands, indicating a period of consolidation.
- Bollinger %B: The %B has been fluctuating around the midline, suggesting a lack of strong trend direction.
Volume Indicators:
- On-Balance Volume (OBV): The OBV has been relatively stable, indicating a balance between buying and selling pressure.
- Chaikin Money Flow (CMF): The CMF has been negative, reflecting a bearish money flow.
Key Observations and Opinions:
- Trend: The trend indicators show a mixed picture with a slight downward bias in the short term.
- Momentum: Momentum indicators suggest a neutral to slightly bearish sentiment in the market.
- Volatility: Volatility indicators point towards a period of consolidation and indecision among market participants.
- Volume: Volume indicators indicate a balanced market sentiment with a slight bearish bias.
Conclusion:
Based on the analysis of the technical indicators, the next few days for VGIT could see sideways movement with a slight bearish bias. Traders may expect the stock price to consolidate within a range, with potential for a minor downward correction. It is advisable to closely monitor key support and resistance levels for potential entry or exit points.
Disclaimer:
Remember that technical analysis is not a guaranteed predictor of future price movements, and other fundamental factors can influence stock prices. It is essential to conduct thorough research and consider multiple indicators before making any investment decisions. Consulting with a financial advisor is recommended for personalized investment advice.