Technical Analysis of XLP 2024-05-31
Overview:
In analyzing the technical indicators for XLP over the last 5 days, we will delve into the trend, momentum, volatility, and volume indicators to provide a comprehensive outlook on the possible stock price movement in the coming days. By examining these key indicators, we aim to offer valuable insights and predictions for informed decision-making.
Trend Analysis:
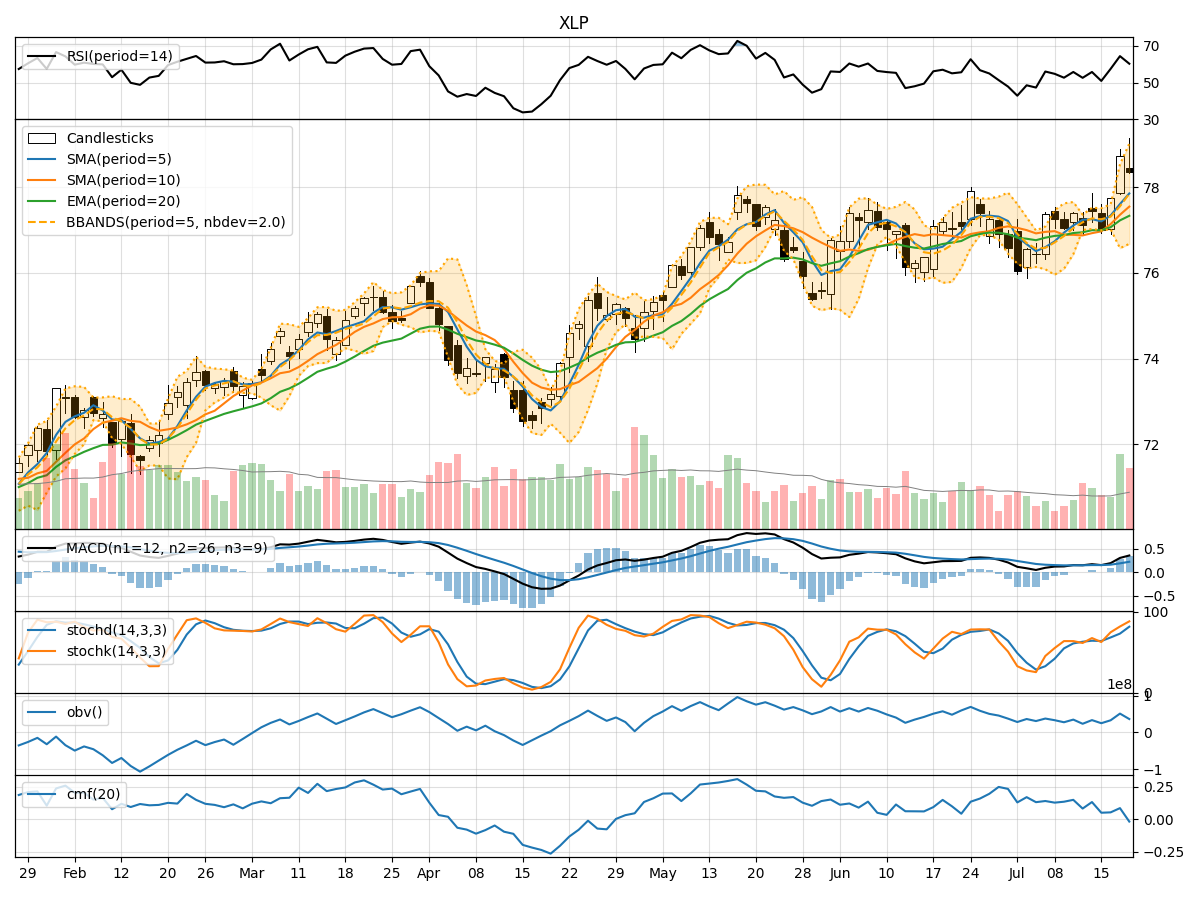
- Moving Averages (MA): The 5-day MA has been gradually decreasing, indicating a short-term bearish trend.
- MACD: The MACD line has been consistently positive, but the MACD Histogram has been decreasing, suggesting a weakening bullish momentum.
Key Observation: The short-term trend is bearish, with weakening bullish momentum.
Momentum Analysis:
- RSI: The RSI has been fluctuating within the neutral zone, indicating indecision in the market.
- Stochastic Oscillator: Both %K and %D have been in oversold territory, signaling a potential reversal.
Key Observation: Momentum is currently neutral with a potential for a bullish reversal.
Volatility Analysis:
- Bollinger Bands (BB): The stock price has been trading within the bands, showing no extreme volatility.
Key Observation: Volatility is relatively stable, with no significant price movements.
Volume Analysis:
- On-Balance Volume (OBV): The OBV has been fluctuating, indicating mixed buying and selling pressure.
- Chaikin Money Flow (CMF): The CMF has been positive but decreasing, suggesting weakening buying pressure.
Key Observation: Volume indicators show mixed signals with a slight bias towards selling pressure.
Conclusion:
Based on the analysis of the technical indicators, the next few days' possible stock price movement for XLP is sideways consolidation with a slight bullish bias. The trend is currently bearish, but momentum indicators suggest a potential bullish reversal. Volatility remains stable, while volume indicators show mixed signals leaning towards selling pressure. Traders should monitor the momentum indicators closely for a potential shift in market sentiment.