Technical Analysis of LEGT 2024-05-31
Overview:
In analyzing the technical indicators for LEGT over the last 5 days, we will delve into the trend, momentum, volatility, and volume indicators to provide a comprehensive outlook on the possible stock price movement in the coming days. By examining these key indicators, we aim to offer valuable insights and recommendations for potential investors.
Trend Indicators:
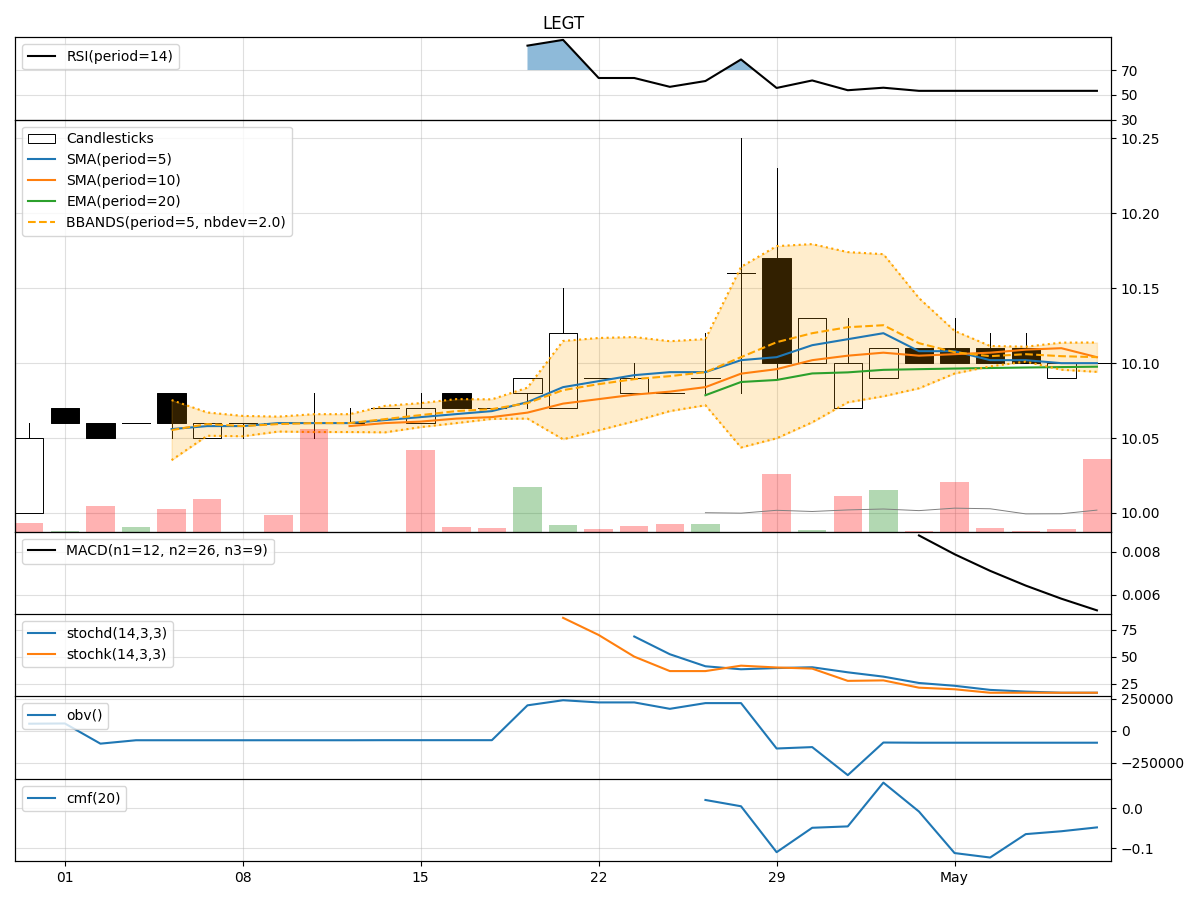
- Moving Averages (MA): The 5-day MA has been relatively stable around the current price, indicating a neutral short-term trend.
- MACD: The MACD line has been fluctuating around the signal line, suggesting a lack of strong momentum in either direction.
- MACD Histogram: The histogram has been mostly negative, indicating a potential weakening of bullish momentum.
Momentum Indicators:
- RSI: The RSI has been fluctuating around the 50 level, indicating a lack of strong overbought or oversold conditions.
- Stochastic Oscillator: Both %K and %D have been fluctuating, showing indecision in momentum.
- Williams %R: The indicator has been hovering in oversold territory, suggesting a potential reversal.
Volatility Indicators:
- Bollinger Bands: The bands have been relatively narrow, indicating low volatility and a potential period of consolidation.
- Bollinger %B: The %B indicator has been fluctuating around the middle line, further confirming the consolidation phase.
Volume Indicators:
- On-Balance Volume (OBV): The OBV has been relatively flat, suggesting a balance between buying and selling pressure.
- Chaikin Money Flow (CMF): The CMF has been negative, indicating a slight outflow of money from the stock.
Key Observations and Opinions:
- Trend: The stock is currently in a consolidation phase with no clear trend direction.
- Momentum: Momentum indicators show mixed signals with no strong bullish or bearish bias.
- Volatility: Low volatility and narrow Bollinger Bands suggest a period of consolidation.
- Volume: Volume indicators indicate a lack of significant buying or selling pressure.
Conclusion:
Based on the analysis of the technical indicators, the stock price of LEGT is likely to continue trading sideways in the next few days. The lack of clear trend direction, mixed momentum signals, low volatility, and balanced volume suggest a period of consolidation. Investors may consider staying on the sidelines until a clearer trend emerges.