Technical Analysis of ACAC 2024-05-31
Overview:
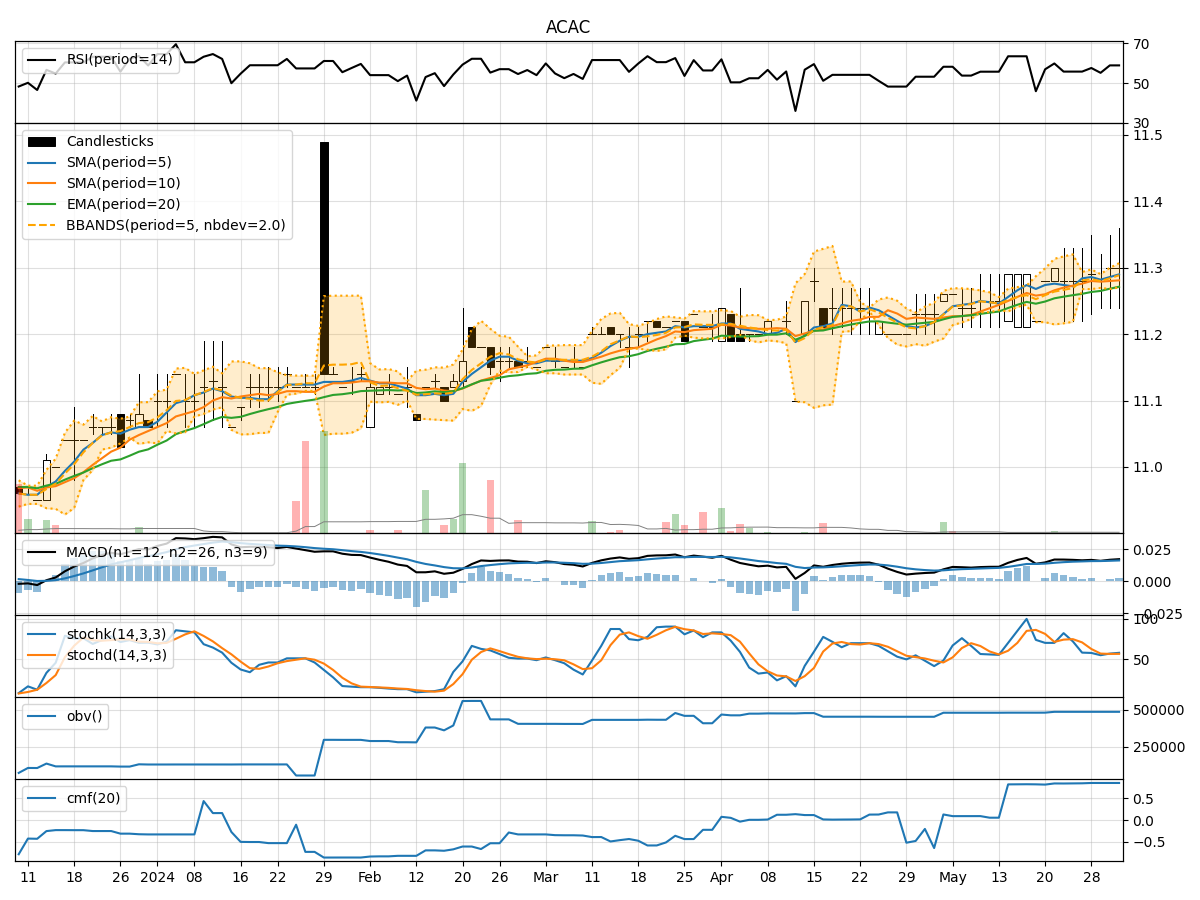
In analyzing the technical indicators for ACAC over the last 5 days, we will delve into the trend, momentum, volatility, and volume indicators to provide a comprehensive outlook on the possible stock price movement in the coming days.
Trend Indicators:
- Moving Averages (MA): The 5-day Moving Average has been relatively stable around the current price, indicating a neutral trend.
- MACD: The MACD line has been consistently positive, suggesting a bullish momentum in the short term.
- MACD Histogram: The MACD Histogram has been increasing, indicating strengthening bullish momentum.
Momentum Indicators:
- RSI: The Relative Strength Index has been hovering around the mid-level, indicating a neutral momentum.
- Stochastic Oscillator: Both %K and %D have been fluctuating within a range, suggesting indecision in momentum.
- Williams %R: The Williams %R is showing oversold conditions, potentially signaling a reversal in momentum.
Volatility Indicators:
- Bollinger Bands: The Bollinger Bands have been relatively tight, indicating low volatility in the stock price.
- Bollinger %B: The %B indicator has been fluctuating around the mid-level, reflecting a lack of clear direction in volatility.
Volume Indicators:
- On-Balance Volume (OBV): The OBV has remained constant, suggesting a balance between buying and selling pressure.
- Chaikin Money Flow (CMF): The CMF has been positive, indicating a potential inflow of money into the stock.
Key Observations:
- The trend indicators show a neutral stance with a slight bullish bias based on the MACD.
- Momentum indicators suggest a lack of clear direction, with some signs of potential reversal in momentum.
- Volatility indicators point towards low volatility and a lack of significant price movements.
- Volume indicators indicate a balanced buying and selling pressure with a positive money flow into the stock.
Conclusion:
Based on the analysis of the technical indicators, the stock of ACAC is likely to experience sideways movement in the coming days. The lack of strong trends in both price and momentum, coupled with low volatility, indicates a period of consolidation. Traders may expect the stock to trade within a narrow range without significant price fluctuations. It is advisable to closely monitor key support and resistance levels for potential breakout opportunities in the future.