Technical Analysis of BLAC 2024-05-31
Overview:
In analyzing the technical indicators for BLAC over the last 5 days, we will delve into the trend, momentum, volatility, and volume indicators to provide a comprehensive outlook on the possible stock price movement in the coming days. By examining these key indicators, we aim to offer valuable insights and predictions to guide investment decisions.
Trend Analysis:
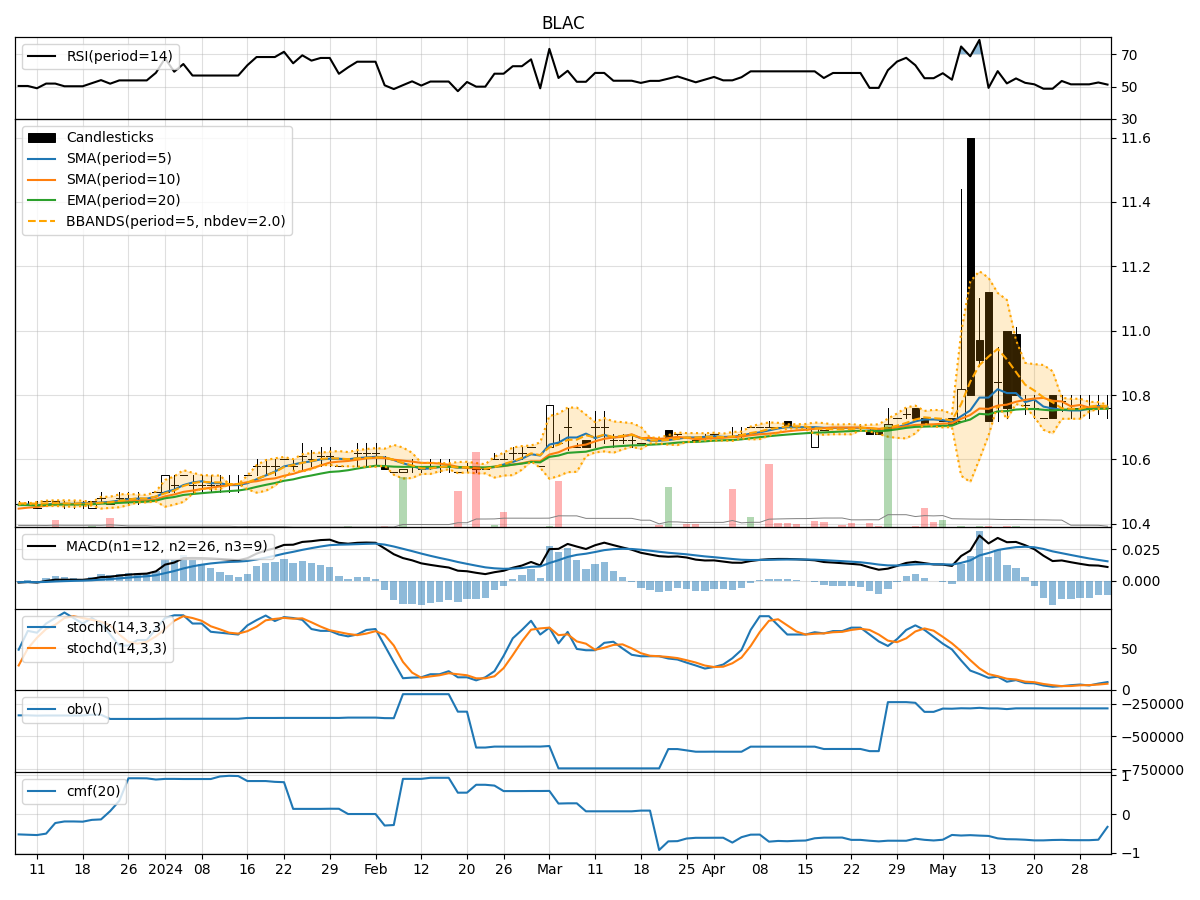
- Moving Averages (MA): The 5-day MA has been relatively stable around the closing price, indicating a lack of significant trend direction.
- MACD: The MACD line has been hovering around the signal line, suggesting a balanced momentum in the short term.
- RSI: The RSI has been around the neutral zone, indicating a lack of strong buying or selling pressure.
Momentum Analysis:
- Stochastic Oscillator: The Stochastic Oscillator has shown some fluctuations but remains within a neutral range, reflecting indecision in the market.
- Williams %R (WillR): The Williams %R has been consistently in oversold territory, signaling a potential reversal in the short term.
Volatility Analysis:
- Bollinger Bands (BB): The Bollinger Bands have been narrowing, indicating decreasing volatility and a potential breakout in the near future.
- Average True Range (ATR): The ATR has been relatively low, suggesting a lack of significant price movements.
Volume Analysis:
- On-Balance Volume (OBV): The OBV has remained flat, indicating a balance between buying and selling pressure.
- Chaikin Money Flow (CMF): The CMF has been negative, suggesting a bearish sentiment in the market.
Key Observations:
- The stock has been trading in a tight range with limited price movement.
- Indicators show mixed signals with no clear trend direction.
- Volatility has been decreasing, indicating a potential breakout or consolidation phase.
- Volume indicators suggest a lack of strong buying or selling pressure.
Conclusion:
Based on the analysis of the technical indicators, the stock is likely to experience sideways movement in the coming days. The lack of strong trends, coupled with mixed signals from momentum and volume indicators, suggests a period of consolidation. Traders may expect the stock price to remain range-bound with limited upside or downside potential. It is advisable to closely monitor key support and resistance levels for potential breakout opportunities.