Technical Analysis of BREZ 2024-05-10
Overview:
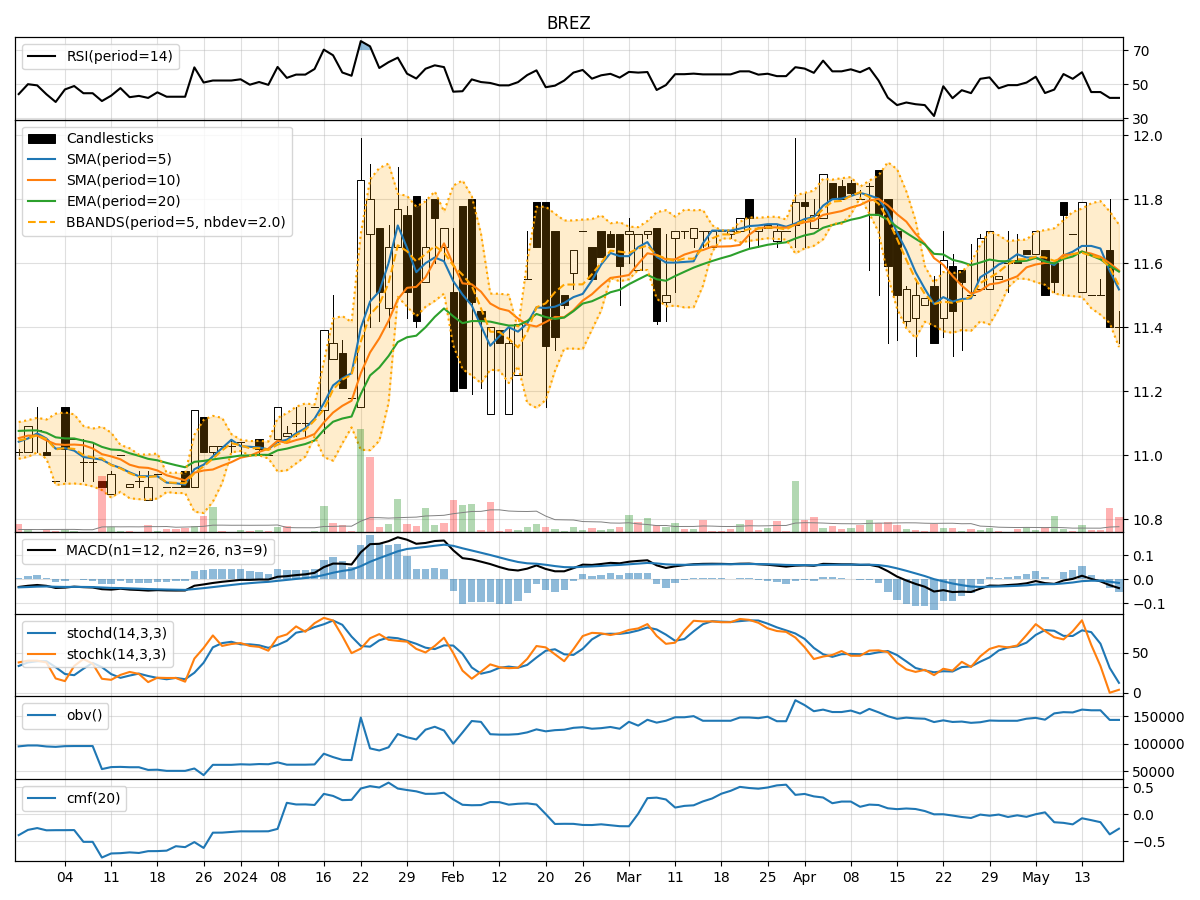
In analyzing the technical indicators for BREZ over the last 5 days, we will delve into the trend, momentum, volatility, and volume indicators to provide a comprehensive outlook on the possible stock price movement in the coming days.
Trend Analysis:
- Moving Averages (MA): The 5-day Moving Average (MA) has been fluctuating around the closing prices, indicating short-term price trends. The Simple Moving Average (SMA) and Exponential Moving Average (EMA) have been relatively close, suggesting stability in the trend.
- MACD: The Moving Average Convergence Divergence (MACD) has been negative, with the MACD line consistently below the signal line. This indicates a bearish trend in the stock price.
- Conclusion: The trend indicators suggest a bearish outlook for the stock in the short term.
Momentum Analysis:
- RSI: The Relative Strength Index (RSI) has been fluctuating around the 50 level, indicating indecision in the market momentum.
- Stochastic Oscillator: Both %K and %D have been fluctuating, but %K has shown some volatility. The stock has been in overbought and oversold conditions during the period.
- Conclusion: The momentum indicators suggest a sideways movement with potential for volatility in the coming days.
Volatility Analysis:
- Bollinger Bands (BB): The stock price has mostly stayed within the Bollinger Bands, with occasional breaches. The bands have widened slightly, indicating increased volatility.
- Conclusion: The volatility indicators suggest a volatile period ahead for the stock.
Volume Analysis:
- On-Balance Volume (OBV): The OBV has shown mixed movements, indicating no clear accumulation or distribution pattern.
- Chaikin Money Flow (CMF): The CMF has been negative, suggesting selling pressure in the stock.
- Conclusion: The volume indicators suggest a neutral to bearish sentiment in the market.
Overall Conclusion:
Based on the analysis of trend, momentum, volatility, and volume indicators, the next few days' possible stock price movement for BREZ is likely to be sideways with a bearish bias. The bearish trend indicated by the MACD, coupled with the neutral to bearish sentiment in volume indicators, suggests that the stock may face resistance in its upward movement. The sideways momentum with increased volatility could lead to choppy price action.
Key Takeaways: - Trend: Bearish - Momentum: Sideways - Volatility: Volatile - Volume: Neutral to Bearish
Recommendation: It is advisable for investors to exercise caution and closely monitor the stock price movement. Consider setting stop-loss orders to manage risk effectively in the current market conditions.