Technical Analysis of BTCY 2024-05-31
Overview:
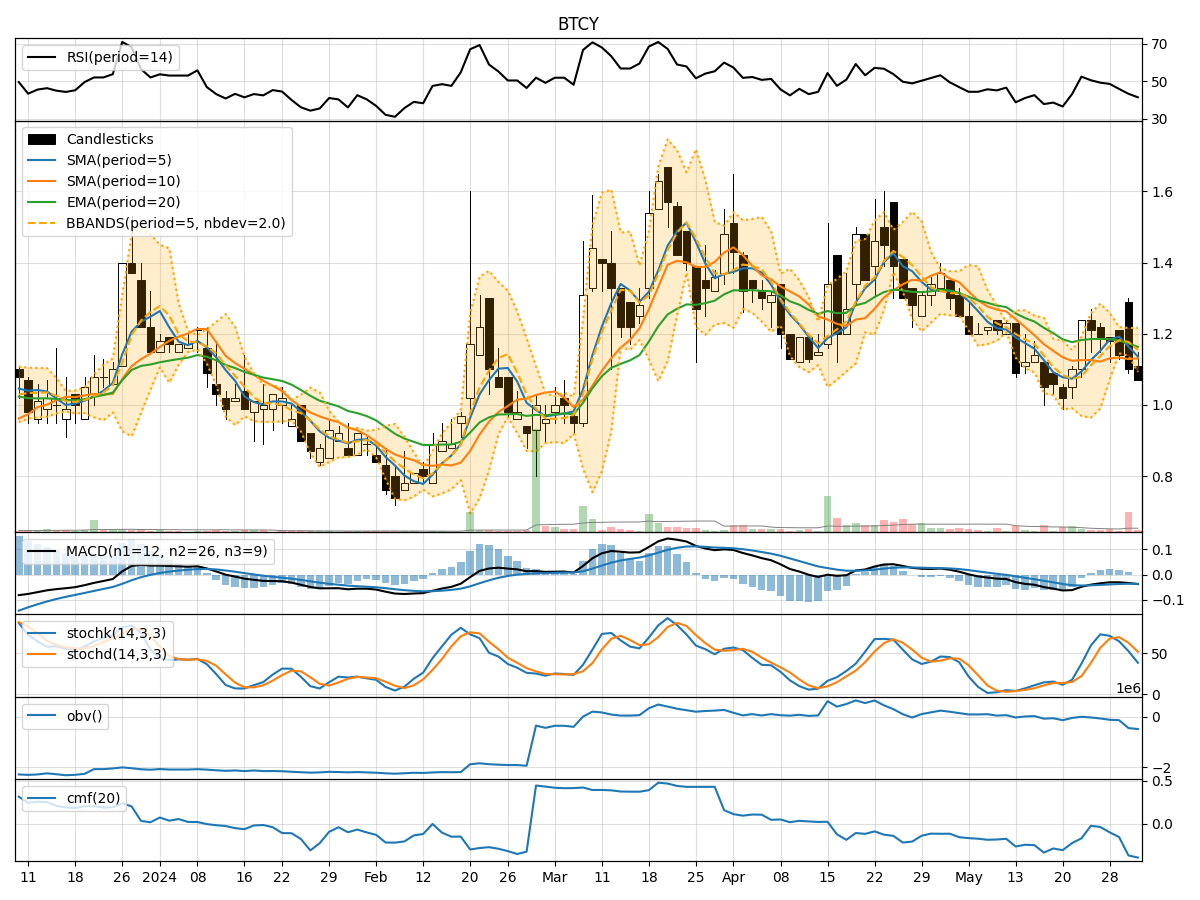
In analyzing the technical indicators for BTCY over the last 5 days, we will delve into the trend, momentum, volatility, and volume indicators to provide a comprehensive outlook on the possible stock price movement in the coming days. By examining these key aspects, we aim to offer valuable insights and recommendations for potential investors.
Trend Analysis:
- Moving Averages (MA): The 5-day moving average has been fluctuating around the closing prices, indicating short-term price trends. The Simple Moving Average (SMA) and Exponential Moving Average (EMA) show a downward trend, suggesting a bearish sentiment in the market.
- MACD: The Moving Average Convergence Divergence indicates a negative trend with the MACD line consistently below the signal line, signaling a potential downtrend in prices.
Momentum Analysis:
- RSI: The Relative Strength Index has been declining, indicating weakening momentum and potential oversold conditions.
- Stochastic Oscillator: Both %K and %D lines of the Stochastic Oscillator are trending downwards, suggesting a bearish momentum in the market.
- Williams %R: The Williams %R is in the oversold territory, indicating a potential reversal or bounce-back in prices.
Volatility Analysis:
- Bollinger Bands: The Bollinger Bands are narrowing, indicating decreasing volatility in the market. This could precede a period of consolidation or a breakout in either direction.
- Bollinger %B: The %B indicator is hovering around the midline, suggesting a balanced market sentiment with no clear bias towards either bullish or bearish movements.
Volume Analysis:
- On-Balance Volume (OBV): The OBV indicator has been declining, reflecting selling pressure and a potential bearish outlook.
- Chaikin Money Flow (CMF): The CMF is negative, indicating that money is flowing out of the stock, further supporting the bearish sentiment.
Conclusion:
Based on the analysis of the technical indicators, the overall outlook for BTCY in the next few days appears bearish. The trend indicators, momentum oscillators, and volume indicators all point towards a potential downward movement in stock prices. The narrowing Bollinger Bands suggest a period of consolidation before a possible breakout, which could align with the bearish sentiment in the market.
Investors should exercise caution and consider waiting for more clarity in the price action before making any significant trading decisions. It is advisable to closely monitor the key support levels and wait for confirmation of a trend reversal before considering any bullish positions.