Technical Analysis of CBRG 2024-05-31
Overview:
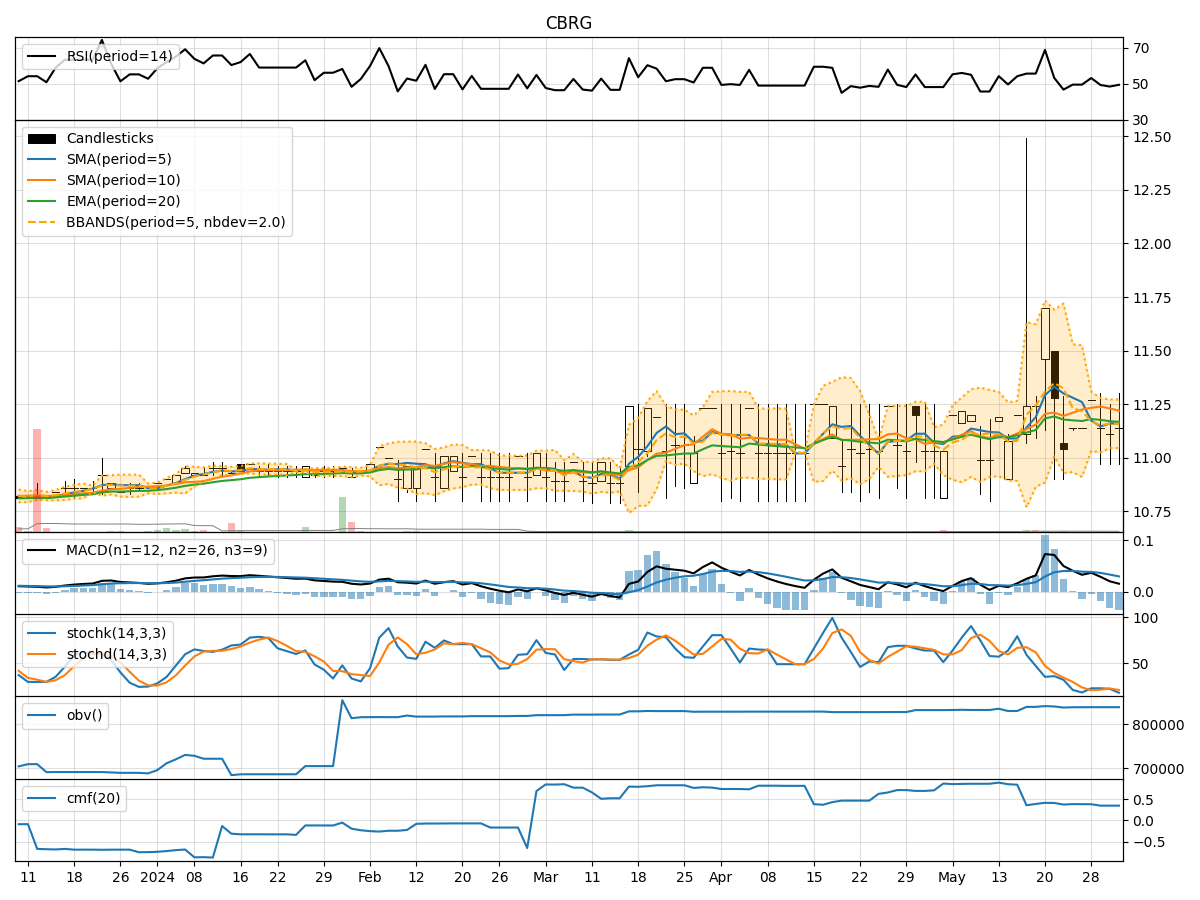
In analyzing the technical indicators for CBRG over the last 5 days, we will delve into the trend, momentum, volatility, and volume indicators to provide a comprehensive outlook on the possible stock price movement in the coming days. By examining these key indicators, we aim to offer valuable insights and predictions for potential investors and traders.
Trend Analysis:
- Moving Averages (MA): The 5-day MA has been fluctuating around the closing prices, indicating a lack of clear trend direction.
- MACD: The MACD line has been positive but decreasing, while the MACD Histogram has been consistently negative, suggesting a potential bearish momentum.
- EMA: The EMA has been relatively stable, reflecting the recent price movements.
Momentum Analysis:
- RSI: The RSI values have been hovering around the mid-range, indicating a neutral momentum with no extreme overbought or oversold conditions.
- Stochastic Oscillator: Both %K and %D have been fluctuating, not providing a clear signal on the momentum direction.
- Williams %R: The Williams %R values have been consistently in the oversold territory, suggesting a potential reversal.
Volatility Analysis:
- Bollinger Bands (BB): The bands have been narrowing, indicating decreasing volatility and a potential upcoming price breakout.
- BB %B: The %B values have been relatively low, suggesting a possible oversold condition.
Volume Analysis:
- On-Balance Volume (OBV): The OBV has remained constant, indicating a lack of significant buying or selling pressure.
- Chaikin Money Flow (CMF): The CMF has been relatively stable, showing a neutral money flow trend.
Key Observations:
- The trend indicators suggest a lack of clear direction, with a potential bearish bias indicated by the MACD.
- Momentum indicators show a neutral stance with a slight inclination towards oversold conditions.
- Volatility is decreasing, hinting at a potential upcoming price breakout.
- Volume indicators reflect a balanced market sentiment with no significant buying or selling pressure.
Conclusion:
Based on the analysis of the technical indicators, the stock price of CBRG is likely to experience sideways movement in the next few days. The lack of a clear trend direction, coupled with neutral momentum and volume signals, indicates a period of consolidation. However, the decreasing volatility suggests a potential breakout in the near future, which could lead to a shift in the price direction. Traders should closely monitor the price action for any signs of a breakout or trend reversal before making trading decisions.