Technical Analysis of CRAI 2024-05-31
Overview:
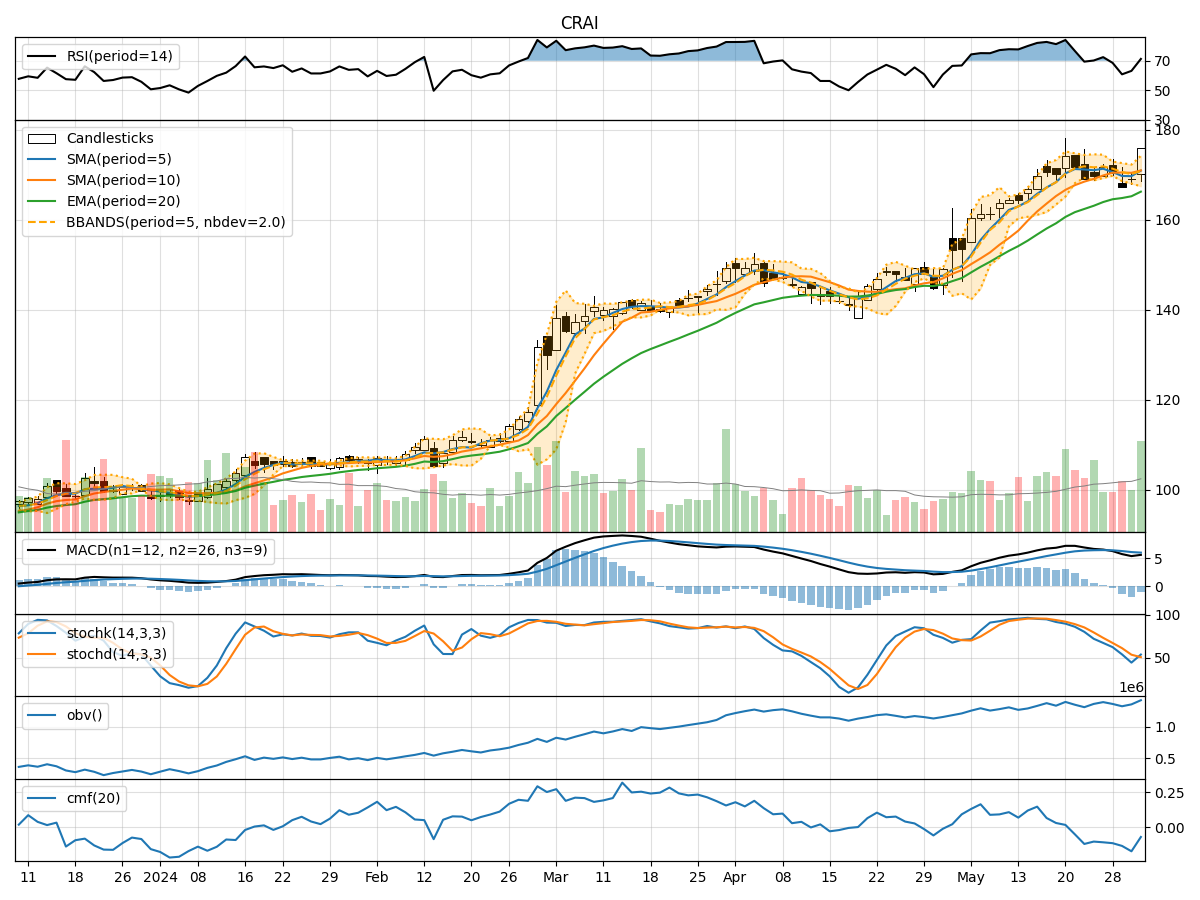
In the last 5 trading days, the stock price of CRAI has shown some fluctuations, with a mix of bullish and bearish signals across various technical indicators. By analyzing the trend, momentum, volatility, and volume indicators, we can gain insights into the possible future price movement of CRAI stock.
Trend Analysis:
- The Moving Average (MA) indicators show a slight uptrend, with the 5-day MA consistently above the 10-day Simple Moving Average (SMA).
- The Exponential Moving Average (EMA) indicates a gradual increase in the stock price over the past 20 days.
- The Moving Average Convergence Divergence (MACD) is negative but showing signs of convergence towards the signal line.
Momentum Analysis:
- The Relative Strength Index (RSI) has been fluctuating but is currently in the overbought territory, suggesting a potential reversal.
- The Stochastic Oscillator indicates a bearish crossover, signaling a possible downward momentum.
- The Williams %R (Willams %R) is in the oversold region, indicating a potential buying opportunity.
Volatility Analysis:
- The Bollinger Bands (BB) are narrowing, indicating decreasing volatility in the stock price.
- The %B indicator is hovering around the midpoint, suggesting a balanced market sentiment.
Volume Analysis:
- The On-Balance Volume (OBV) has been relatively stable, indicating a neutral volume flow.
- The Chaikin Money Flow (CMF) is negative, suggesting some selling pressure in the stock.
Key Observations:
- Trend: The stock is in a slight uptrend based on moving averages, but the MACD signals potential weakness.
- Momentum: RSI and Stochastic Oscillator suggest conflicting signals, with RSI in overbought territory and Stochastic showing a bearish crossover.
- Volatility: Bollinger Bands narrowing indicate a potential breakout, while %B suggests a balanced sentiment.
- Volume: OBV is neutral, but CMF indicates some selling pressure.
Conclusion:
Based on the analysis of technical indicators, the next few days' possible stock price movement for CRAI is likely to be sideways with a slight bearish bias. The conflicting signals from momentum indicators, coupled with narrowing Bollinger Bands and negative CMF, suggest a period of consolidation or minor downward correction. Traders should exercise caution and consider waiting for clearer signals before making significant trading decisions.