Technical Analysis of CRBP 2024-05-31
Overview:
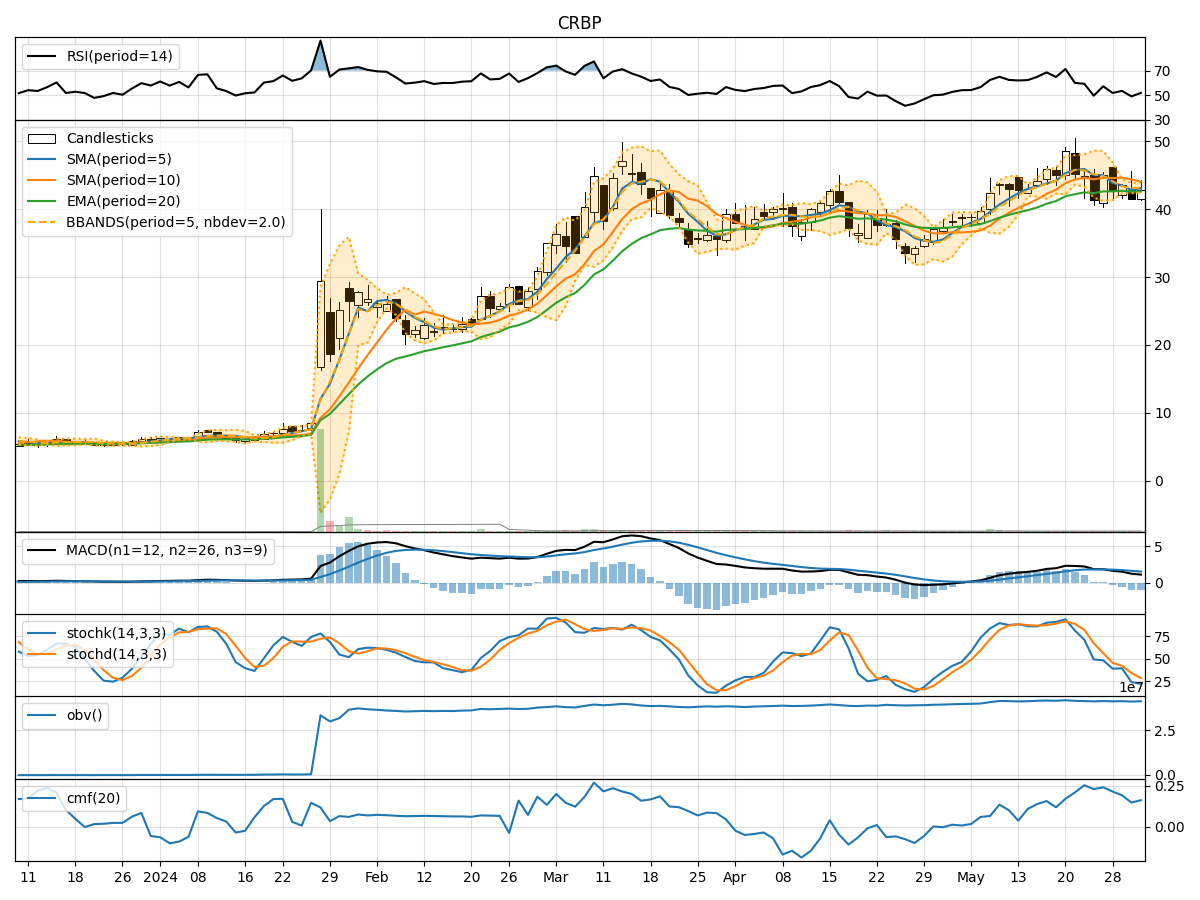
In analyzing the technical indicators for CRBP over the last 5 days, we will delve into the trend, momentum, volatility, and volume indicators to provide a comprehensive outlook on the possible stock price movement in the coming days.
Trend Analysis:
- Moving Averages (MA): The 5-day MA has been fluctuating around the closing prices, indicating short-term price trends. The SMA(10) and EMA(20) have shown slight variations but have not provided a clear trend direction.
- MACD: The MACD line has been fluctuating above and below the signal line, suggesting indecision in price momentum.
- MACD Histogram: The MACD Histogram has been negative, indicating a bearish momentum.
Momentum Analysis:
- RSI: The RSI has been oscillating around the 50 level, indicating a lack of strong momentum in either direction.
- Stochastic Oscillator: Both %K and %D have been in oversold territory, suggesting a potential reversal in price.
- Williams %R: The Williams %R has been in oversold territory, indicating a possible buying opportunity.
Volatility Analysis:
- Bollinger Bands (BB): The price has been trading within the bands, suggesting a period of consolidation. The bands have not shown significant expansion or contraction.
- Bollinger %B: The %B indicator has been hovering around the midline, indicating neutrality in price movement.
Volume Analysis:
- On-Balance Volume (OBV): The OBV has shown mixed signals, with no clear trend in volume accumulation or distribution.
- Chaikin Money Flow (CMF): The CMF has been relatively stable around the zero line, indicating a balance between buying and selling pressure.
Key Observations:
- The trend indicators show a lack of clear direction, with mixed signals from moving averages and MACD.
- Momentum indicators suggest a potential reversal in price, as the stochastic oscillator and Williams %R are in oversold territory.
- Volatility indicators point towards a period of consolidation, as the Bollinger Bands have not shown significant movement.
- Volume indicators do not provide a strong indication of accumulation or distribution.
Conclusion:
Based on the analysis of the technical indicators, the next few days for CRBP are likely to see sideways movement with a potential for a bullish reversal. Traders should closely monitor the stochastic oscillator and Williams %R for signs of a price reversal. Additionally, keeping an eye on the RSI for any potential shifts in momentum would be crucial. The stock is expected to consolidate within the Bollinger Bands, indicating a period of indecision in the market. Overall, a cautious approach with a bullish bias is recommended for the upcoming trading sessions.