Technical Analysis of DXPE 2024-05-31
Overview:
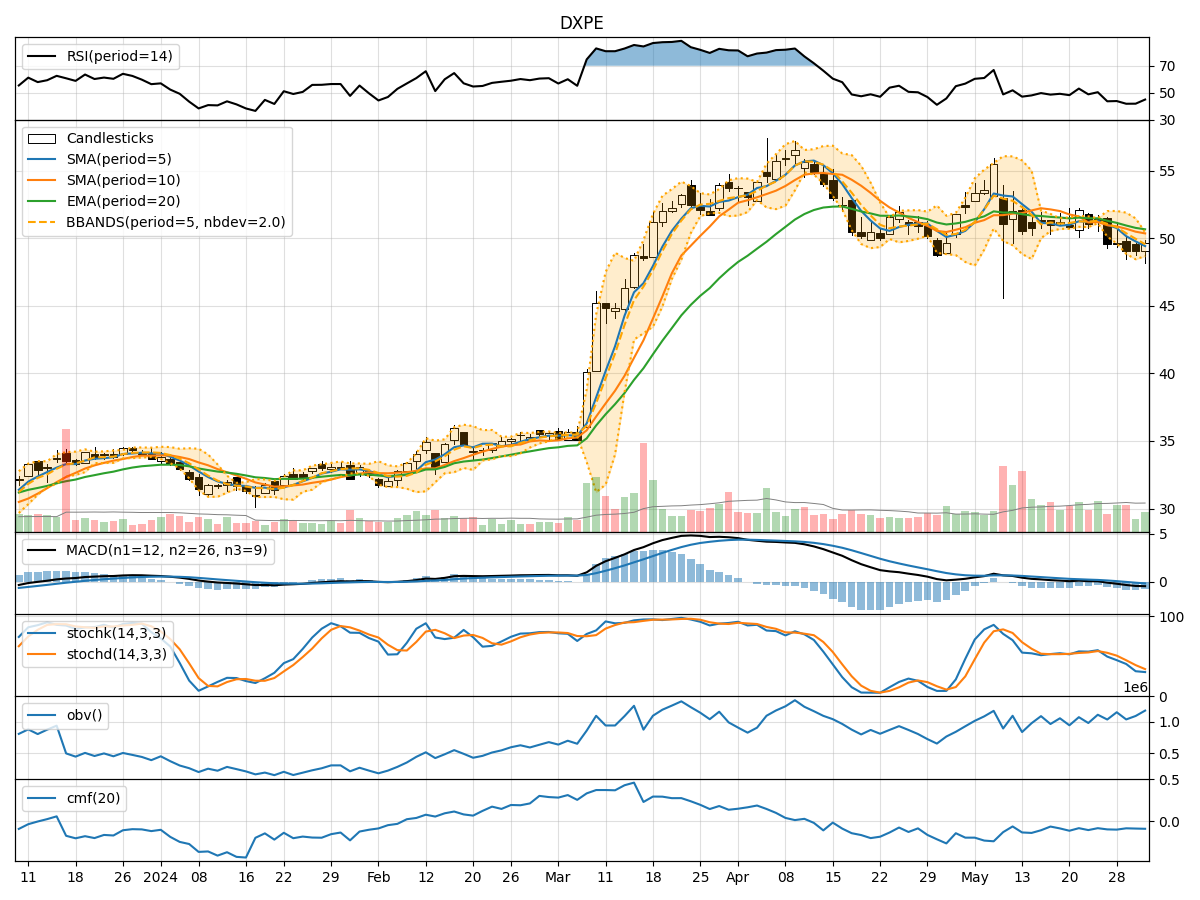
In analyzing the technical indicators for DXPE over the last 5 days, we will delve into the trend, momentum, volatility, and volume indicators to provide a comprehensive assessment of the stock's potential price movement. By examining these key factors, we aim to offer valuable insights and predictions for the next few days.
Trend Analysis:
- Moving Averages (MA): The 5-day MA has been consistently below the closing prices, indicating a short-term downtrend.
- MACD: The MACD line has been decreasing, with the MACD histogram also showing a decline, suggesting weakening momentum.
Key Observation: The trend indicators point towards a bearish sentiment in the short term.
Momentum Analysis:
- RSI: The RSI has been fluctuating around the mid-level, indicating indecision in the market.
- Stochastic Oscillator: Both %K and %D have been decreasing, signaling a potential oversold condition.
Key Observation: Momentum indicators suggest a neutral to slightly bearish outlook.
Volatility Analysis:
- Bollinger Bands (BB): The bands have been narrowing, indicating decreasing volatility.
Key Observation: Volatility is decreasing, which could lead to a sideways or consolidating price movement.
Volume Analysis:
- On-Balance Volume (OBV): The OBV has been fluctuating, showing no clear trend in volume accumulation.
- Chaikin Money Flow (CMF): The CMF has been negative, indicating selling pressure.
Key Observation: Volume indicators suggest mixed signals with no clear direction.
Conclusion:
Based on the analysis of the technical indicators, the next few days for DXPE could see a continuation of the bearish trend in the short term. The momentum indicators support a neutral to slightly bearish sentiment, while decreasing volatility may lead to a sideways or consolidating price movement. Volume indicators provide mixed signals, reflecting uncertainty in market participation.
Overall, the outlook for DXPE in the next few days leans towards a continuation of the bearish trend with potential sideways movement. Traders should exercise caution and closely monitor key levels for potential reversals.