Technical Analysis of FEXD 2024-05-31
Overview:
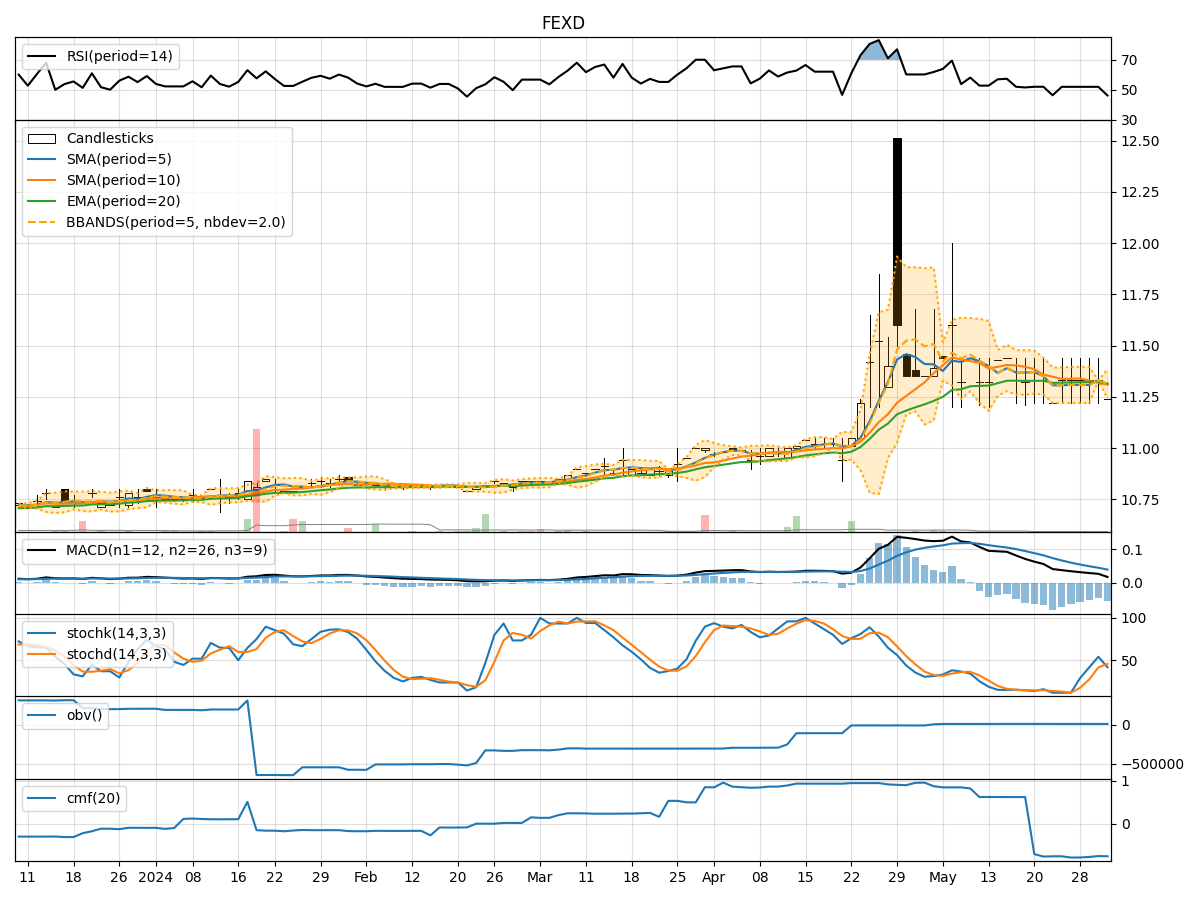
In analyzing the technical indicators for FEXD over the last 5 days, we will delve into the trend, momentum, volatility, and volume indicators to provide a comprehensive outlook on the possible stock price movement in the coming days. By examining these key indicators, we aim to offer valuable insights and predictions for potential investors.
Trend Indicators:
- Moving Averages (MA): The 5-day MA has been relatively stable around the closing price, indicating a lack of significant trend direction.
- MACD: The MACD line has been positive, suggesting a bullish momentum in the short term.
- RSI: The RSI is around 52, indicating a neutral sentiment without any extreme overbought or oversold conditions.
Momentum Indicators:
- Stochastic Oscillator: The stochastic oscillator has been fluctuating within a range, showing indecision in momentum.
- Williams %R (Willr): The Williams %R is indicating oversold conditions, potentially signaling a reversal in momentum.
Volatility Indicators:
- Bollinger Bands (BB): The Bollinger Bands have shown narrowing bands, indicating decreasing volatility and a potential upcoming price breakout.
- Average True Range (ATR): The ATR has been relatively low, suggesting a period of consolidation.
Volume Indicators:
- On-Balance Volume (OBV): The OBV has been relatively flat, indicating a balance between buying and selling pressure.
- Chaikin Money Flow (CMF): The CMF is negative, suggesting a bearish money flow in the short term.
Key Observations and Opinions:
- Trend: The lack of significant movement in the moving averages and the positive MACD line suggest a potential bullish bias in the short term.
- Momentum: The stochastic oscillator and Williams %R indicate mixed momentum signals, with a slight bias towards a potential reversal.
- Volatility: The narrowing Bollinger Bands and low ATR point towards a period of consolidation before a potential breakout.
- Volume: The flat OBV and negative CMF indicate a lack of strong buying interest and bearish money flow.
Conclusion:
Based on the analysis of the technical indicators, the next few days for FEXD could see sideways consolidation with a slight bullish bias. Traders should watch for a potential breakout as volatility increases, potentially leading to a bullish movement. However, caution is advised due to the mixed signals in momentum indicators. It is recommended to closely monitor price action and key support/resistance levels for better decision-making.