Technical Analysis of FNCB 2024-05-31
Overview:
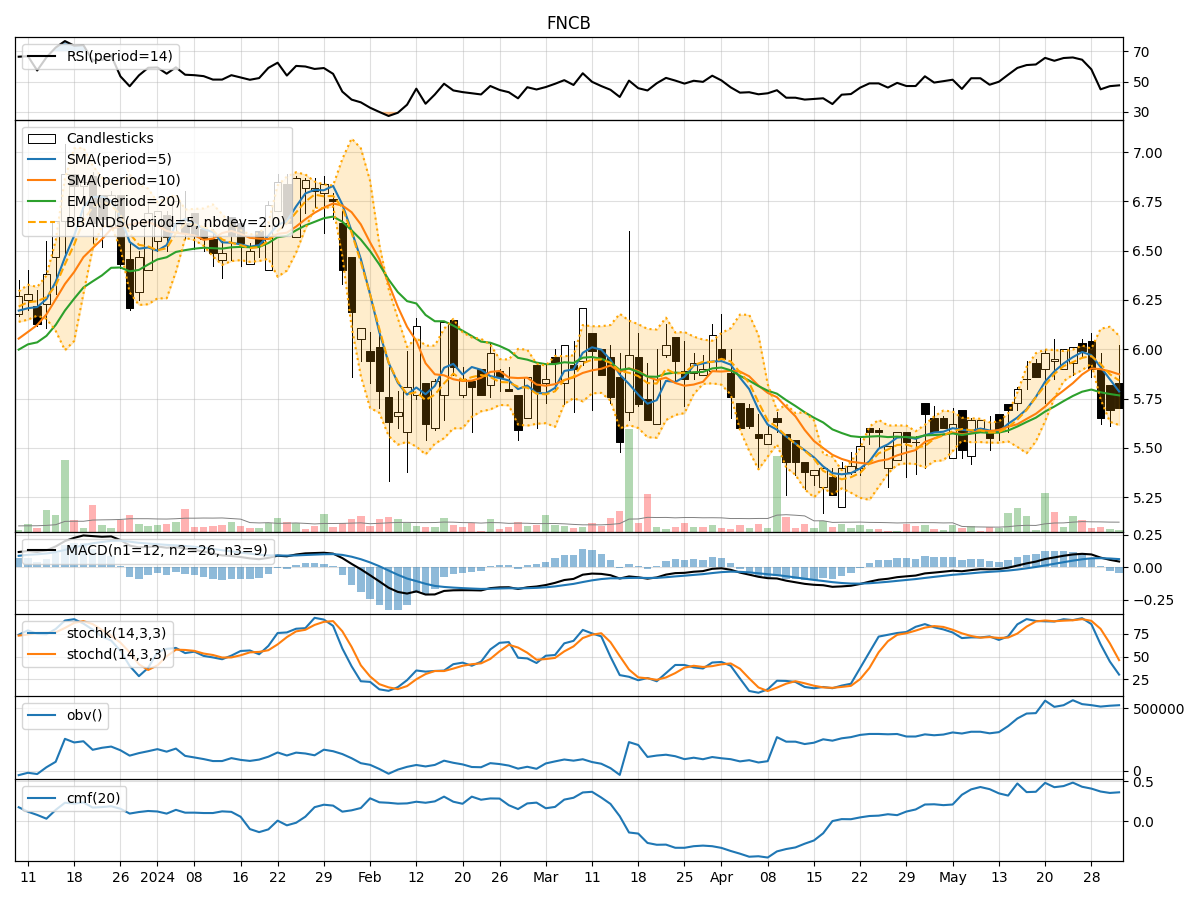
In analyzing the technical indicators for FNCB over the last 5 days, we will delve into the trend, momentum, volatility, and volume indicators to provide a comprehensive outlook on the possible stock price movement in the coming days.
Trend Analysis:
- Moving Averages (MA): The 5-day Moving Average (MA) has been fluctuating around the closing prices, indicating short-term price trends. The Simple Moving Average (SMA) and Exponential Moving Average (EMA) show a slight upward trend.
- MACD: The Moving Average Convergence Divergence (MACD) has been positive, with the MACD line consistently above the signal line, suggesting bullish momentum.
Momentum Analysis:
- RSI: The Relative Strength Index (RSI) has been fluctuating but generally staying above the oversold threshold of 30, indicating potential buying pressure.
- Stochastic Oscillator: Both %K and %D have been declining, moving towards oversold levels, suggesting a potential reversal in the short term.
Volatility Analysis:
- Bollinger Bands (BB): The Bollinger Bands have been narrowing, indicating decreasing volatility. The bands are currently close to the price, suggesting a potential breakout in either direction.
Volume Analysis:
- On-Balance Volume (OBV): The OBV has been relatively stable, indicating a balance between buying and selling pressure.
- Chaikin Money Flow (CMF): The CMF has been positive, indicating buying pressure over the past 20 days.
Key Observations:
- The trend indicators show a potential bullish sentiment with moving averages trending upwards and a positive MACD.
- Momentum indicators suggest a mixed sentiment with RSI fluctuating and stochastic indicators pointing towards a possible reversal.
- Volatility indicators indicate decreasing volatility, potentially leading to a breakout.
- Volume indicators show a balanced buying and selling pressure.
Conclusion:
Based on the analysis of the technical indicators, the stock price of FNCB is likely to experience sideways movement in the coming days. The bullish trend indicated by moving averages and MACD is counteracted by the mixed momentum signals and decreasing volatility. The balanced volume suggests a lack of strong directional bias. Traders should exercise caution and wait for clearer signals before making significant trading decisions.