Technical Analysis of FNCH 2024-05-10
Overview:
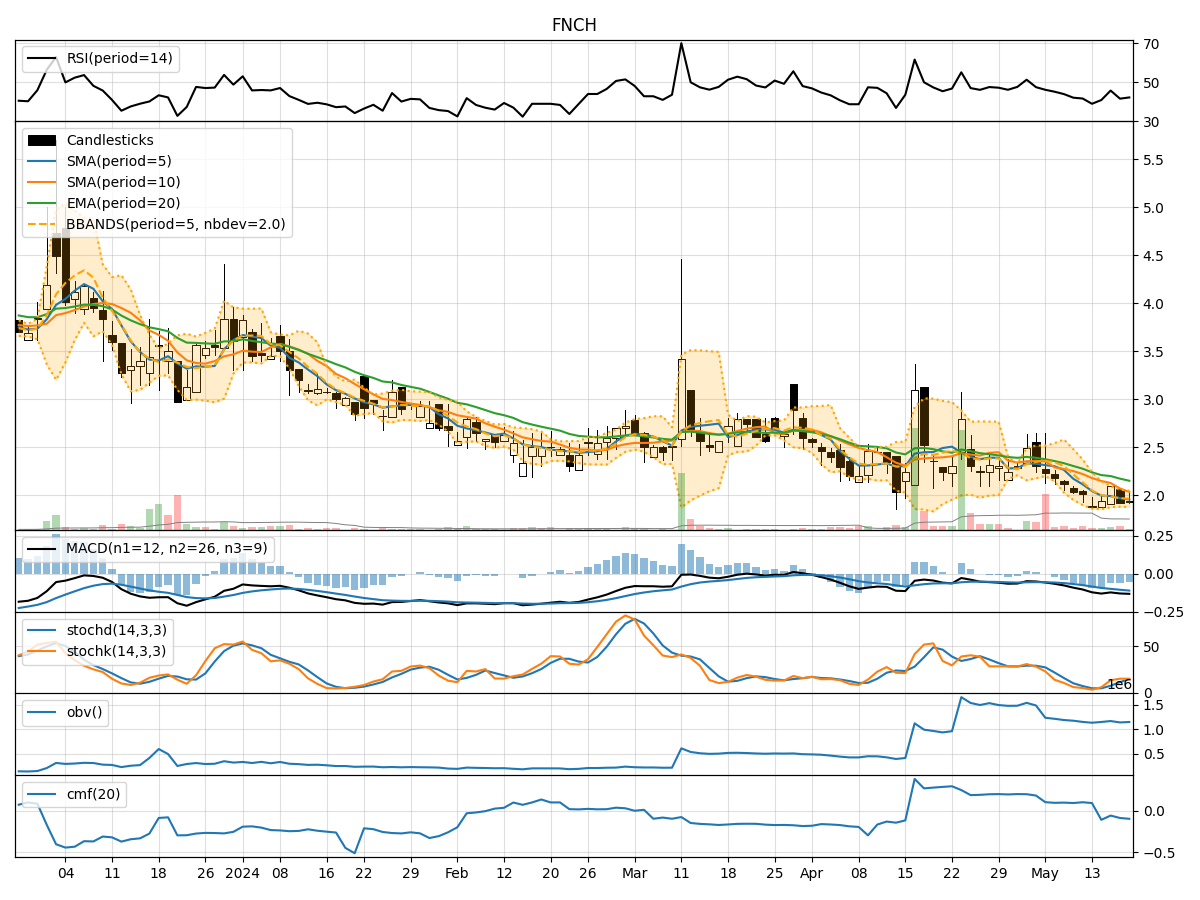
In analyzing the technical indicators for FNCH over the last 5 days, we will delve into the trend, momentum, volatility, and volume indicators to provide a comprehensive outlook on the possible stock price movement. By examining these key aspects, we aim to offer valuable insights and predictions for the upcoming trading days.
Trend Indicators:
- Moving Averages (MA): The 5-day MA has been consistently below the closing price, indicating a short-term downtrend.
- MACD: The MACD line has been negative and decreasing, suggesting a bearish momentum.
- RSI: The RSI has been declining, reflecting weakening buying pressure.
Momentum Indicators:
- Stochastic Oscillator: Both %K and %D have been decreasing, signaling a potential oversold condition.
- Williams %R: The indicator has been in the oversold territory, indicating a possible reversal.
Volatility Indicators:
- Bollinger Bands: The price has been consistently below the lower Bollinger Band, indicating oversold conditions.
- Volatility: Volatility has been decreasing, suggesting a potential stabilization in price movements.
Volume Indicators:
- On-Balance Volume (OBV): The OBV has been declining, indicating selling pressure.
- Chaikin Money Flow (CMF): The CMF has been relatively stable, suggesting a neutral money flow.
Key Observations:
- The stock has been in a downtrend based on moving averages and MACD.
- Momentum indicators suggest a potential oversold condition.
- Volatility has been decreasing, indicating a possible stabilization in price movements.
- Volume indicators show a decline in buying pressure.
Conclusion:
Based on the analysis of the technical indicators, the stock is currently in a bearish phase with a potential for a short-term rebound due to oversold conditions indicated by momentum indicators. However, the overall trend remains downward based on moving averages and MACD. Traders should exercise caution and consider waiting for confirmation of a trend reversal before considering long positions.