Technical Analysis of HYPR 2024-05-31
Overview:
In analyzing the technical indicators for HYPR stock over the last 5 days, we will delve into the trends, momentum, volatility, and volume indicators to provide a comprehensive outlook on the possible stock price movement in the coming days.
Trend Analysis:
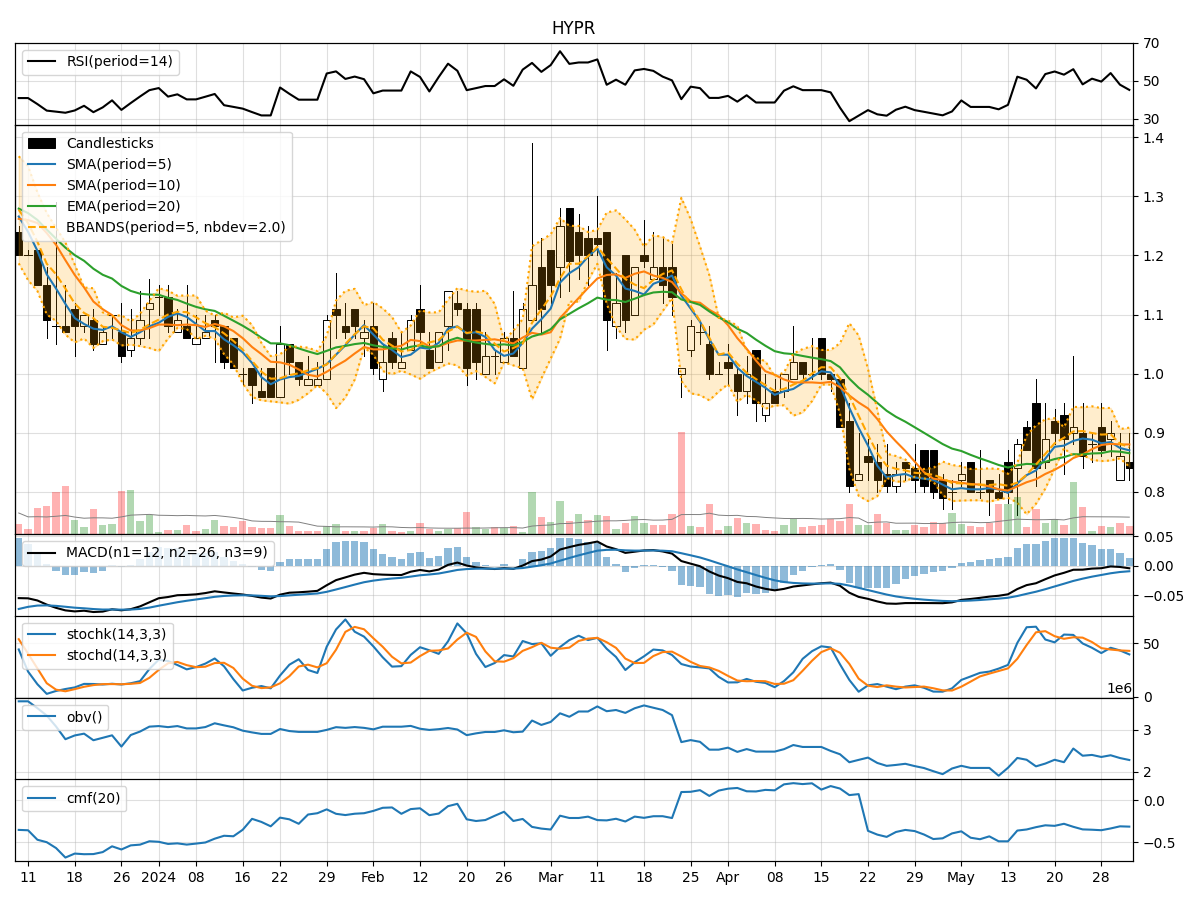
- Moving Averages (MA): The 5-day Moving Average (MA) has been fluctuating around the closing prices, indicating short-term price trends. The Simple Moving Average (SMA) and Exponential Moving Average (EMA) show a slight upward trend, but the MACD and MACD Histogram are negative, suggesting a potential bearish sentiment.
Momentum Analysis:
- Relative Strength Index (RSI): The RSI values have been hovering around the neutral zone, indicating a lack of strong momentum in either direction.
- Stochastic Oscillator: Both %K and %D values are below 50, suggesting a bearish momentum.
- Williams %R (WillR): The Williams %R is in the oversold territory, indicating a potential reversal or consolidation.
Volatility Analysis:
- Bollinger Bands (BB): The Bollinger Bands are narrowing, indicating decreasing volatility. The price has been trading within the bands, suggesting a period of consolidation.
- Bollinger %B (BBP): The %B is relatively low, indicating a potential buying opportunity if the price rebounds.
Volume Analysis:
- On-Balance Volume (OBV): The OBV has been declining, indicating selling pressure and potential bearish sentiment.
- Chaikin Money Flow (CMF): The CMF is negative, suggesting outflow of money from the stock.
Conclusion:
Based on the analysis of the technical indicators, the stock of HYPR is likely to experience further downward movement in the coming days. The trend indicators show a potential bearish sentiment, supported by the negative MACD and declining OBV. The momentum indicators also suggest a lack of strong bullish momentum, with the Stochastic Oscillator and Williams %R indicating a bearish bias. Additionally, the volatility indicators point towards a period of consolidation or sideways movement, further supporting a bearish outlook.
Therefore, it is advisable to exercise caution and consider potential short-selling or wait for a clearer bullish signal before considering long positions in HYPR stock.